


![]()
![]()
![]()
BibTeX | RIS | EndNote | Medlars | ProCite | Reference Manager | RefWorks
Send citation to:
URL: http://ijmm.ir/article-1-1413-en.html


2- Canadian VIGOUR Centre and Department of Medicine, University of Alberta, Edmonton, AB, Canada
3- Health Information Technology Department, School of Allied Medical Sciences, Ahvaz Jundishapur University of Medical Sciences, Ahvaz, Iran
4- Department of Biostatistics and Epidemiology, School of Public Health, Ahvaz Jundishapur University of Medical Sciences, Ahvaz, Iran ,
The coronavirus disease (COVID-19) pandemic has caused numerous deaths and infected all facets of human life since December 2019 (1). Patients with COVID-19 may be asymptomatic or present with a wide variety of symptoms, ranging from respiratory to cardiac, urinary, neurological, and other symptoms. Fever, cough, sore throat, myalgia, nausea, anorexia, diarrhea, and vomiting are the most common clinical signs (2). As of May 29th, 2021, the World Health Organization (WHO) has reported over 169 million laboratory-confirmed cases of COVID-19 and over 3.5 million deaths worldwide (https://covid19.who.int/). By this date, Iran has reported over 2.8 million confirmed cases and about 80 thousand deaths related to COVID-19. The increasing trend of infected cases in Iran might be due to several factors such as premature and inefficient reopening policies, the absence of traveling restrictions alongside open borders, and the lack of public adherence to social distancing recommendations (3).
In southwestern Iran, Khuzestan province is one of the hardest-hit regions in Iran, facing a rapid surge in cases during the 4th wave of COVID-19 in recent months (4). The novel coronavirus variant discovered first in the United Kingdom is wreaking havoc on the region. Besides, the hazard grows due to the continued economic and social interactions with the neighboring country, Iraq, during the pandemic. As the number of cases increases, more patients may require limited healthcare resources such as ventilators or intensive care unit (ICU) beds, which could overwhelm the healthcare system and lead to increased mortality.
A proportion of cases present to the emergency department via emergency medical services (EMS). Delayed presentation to the hospital may negatively affect the odds of survival from COVID-19 infection. It is critical to assess the factors associated with different modes of hospital presentation and experi-encing adverse outcomes in the hospital. Hence, in this study, we intend to investigate the factors asso-ciated with the mode of hospital presentation and time to death/discharge from the hospital using a joint modeling approach.
Patient Population
For this historical cohort study, we used the data from the Ahvaz Jundishapur University of Medical Sciences (AJUMS) database. The study was approved by the Ethical Review Board of the AJUMS. The patient population consisted of 22,356 patients with confirmed COVID-19 infection across 34 medical cent-ers/hospitals in Khuzestan province, Iran, from February 18th, 2020, to January 5th, 2021. The COVID-19 infections were confirmed using the national protocol for COVID-19 diagnosis (5).
Variables
The studied factors included demographic variables such as age and gender; signs or symptoms at presentation such as asymptomatic presentation, fever, chills, cough, respiratory distress, sore throat, anorexia, dizziness, anosmia, dysgeusia, headache, myalgia, chest pain, abdominal pain, nausea, vomit-ing, gastrointestinal bleeding, diarrhea, convulsion, loss of consciousness, paresis, and paralysis; como-rbidities such as asthma, other chronic lung diseases, chronic kidney disease, chronic liver disease, hyper-tension, diabetes, heart disease, cancer, drug abuse, any kind of nervous system disease, and pregnancy; clinical characteristics such as contact with a confirmed case, Path to COVID-19 diagnosis (clinical manifestation/ only positive PCR/ positive PCR and abnormal computed tomography scans), and hospital ward (general/ isolated/ICU).
Primary Outcomes
The binary outcome of interest was the mode of presentation to the hospital (EMS=0 if self-presented, and EMS=1 if presentation via ambulance) and the time to death/discharge from hospital (in-hospital mortality=1 if death, and in-hospital mortality=0 if discharge).
Statistical Analysis
The information in this study is recorded in a two-level framework. This hierarchical structure has a pyramid form with observations from the patients at the lower level (level one) nested within hospitals at the higher level (level two). In other words, a fraction of variability between patient outcomes may be due to differences between hospitals. The outcome variables for an individual patient may be influenced by the hospital, and multilevel models has the ability to partition variation into different levels. Two response variables, i.e., mode of presentation (pre-sentation via ambulance versus self-presentation) and time to disposition from the hospital (death as failure and discharge as censoring), are recorded at the subject level. To combine the response variables and to assess the simultaneous impact of independent variables on the associated outcomes, we used a joint model for clustered binary response and survival time through a bivariate random effect (6). The binary outcome was assessed using a multilevel logistic regression submodel, and the time to death/discharge was assessed using a multilevel cox regression sub-model. The association between the two response variables was subsequently studied using a covariance matrix of random effects in each of the submodels. The joint model is defined as follows:
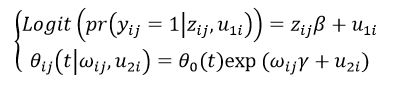
In the above formula and for hospital “i” and patient “j”, is the binary response variable, is the matrix of covariates, is the vector of coefficients, is the random intercept of the logistic submodel, is the baseline hazard function, “t” is the time to event, is the matrix of survival predictors, is the vector of survival coefficients, and is the random intercept of the survival submodel.
In this study, we performed three different mode-ling approaches, including multilevel univariate simple (one response and one predictor in a multilevel framework), multilevel univariate multiple (one respo-nse and multiple predictors in a multilevel frame-work), and multilevel joint (two responses and multiple predictors in a multilevel framework). The performance of the multiple multilevel models is compared using the likelihood ratio test. Variables with P-value less than 0.1 in the univariate simple models were entered in the multiple approaches.
The estimated coefficients in the logistic regression submodel were interpreted as odds ratio, and the estimated coefficients in the Cox regression submodel were interpretable as hazard ratio. A penalized likelihood function is used to estimate the coefficients, and the Newton-Raphson method is utilized to optimize the estimations. The package “bhm” in R programming software (http://www.R-project.org) was used to implement multilevel joint modeling in this study.
Among the study patients, the mean age was 52.2 (24.4) years, and 47.9% were women. A total of 2514 (11.2%) patients died in the hospital. Only 3171 (14.2%) cases were presented to the hospitals and medical centers via ambulance. The baseline demo-graphic and clinical characteristics in those with different modes of presentation and different in-hospital outcomes were presented in Table 1.
Patients who presented with ambulance and those who had Covid-19 in-hospital mortality had higher age and were more frequently men. These patients had a higher burden of comorbidities than those without these outcomes. They generally had lower rates of non-specific viral infection-related signs and sym-ptoms such as fever or myalgia, compared to those who self-presented to the hospital or those who survived, but more serious symptoms such as res-piratory distress or loss of consciousness. Prior contact with the confirmed cases of covid-19 was not different between groups with and without EMS utilization, but it was associated with higher in-hospital mortality. A higher proportion of patients who activated EMS or died in hospital had objective findings in favor of COVID-19 infection, and similarly, a higher proportion was admitted to ICU (Table 1).
Table 1. Patient characteristics among those who self-presented or used ambulance, and among those with or without in-hospital mortality
| Variables | EMS | In-hospital mortality | |||||
|---|---|---|---|---|---|---|---|
| No | Yes | P | No | Yes | P | ||
| Demographics | |||||||
| Age, years; mean (SD) | 51.8 (20.5) | 55.3 (40.9) | <0.001 | 50.7 (20.3) | 64.9 (43.3) | <0.001 | |
| Female Gender | 9274 (48.3%) | 1429 (45.1%) | 0.001 | 9621 (48.5%) | 1082 (43.0%) | <0.001 | |
| Comorbidity | |||||||
| Asthma | 377 (2.0%) | 71 (2.2%) | 0.308 | 404 (2.0%) | 44.0 (1.8%) | 0.335 | |
| Other chronic lung diseases | 429 (2.2%) | 97 (3.1%) | 0.005 | 442 (2.2%) | 84 (3.3%) | 0.001 | |
| Chronic kidney disease | 532 (2.8%) | 108 (3.4%) | 0.048 | 514 (2.6%) | 126 (5.0%) | <0.001 | |
| Chronic liver disease | 93 (0.5%) | 12 (0.4%) | 0.417 | 85 (0.4%) | 20 (0.8%) | 0.001 | |
| Hypertension | 2203 (11.5%) | 361 (11.4%) | 0.872 | 2184 (11.0%) | 380 (15.1%) | <0.001 | |
| Diabetes | 2578 (13.4%) | 470 (14.8%) | 0.035 | 2600 (13.1%) | 448 (17.8%) | <0.001 | |
| Heart disease | 1907 (9.9%) | 329 (10.4%) | 0.449 | 1882 (9.5%) | 354 (14.1%) | <0.001 | |
| Cancer | 444 (2.3%) | 59 (1.9%) | 0.111 | 407 (2.1%) | 96 (3.8%) | <0.001 | |
| Drug abuse | 96 (0.5%) | 54 (1.7%) | <0.001 | 118 (0.6%) | 32 (1.3%) | <0.001 | |
| Nervous system diseases | 248 (1.3%) | 59 (1.9%) | 0.011 | 256 (1.3%) | 51 (2.0%) | 0.003 | |
| Pregnancy | 188 (1.0%) | 14 (0.4%) | 0.003 | 199 (1.0%) | 3 (0.1%) | <0.001 | |
| Signs/Symptoms | |||||||
| Asymptomatic | 318 (1.7%) | 41 (1.3%) | 0.13 | 328 (1.7%) | 31 (1.2%) | 0.115 | |
| Fever | 8258 (43.0%) | 1215 (38.3%) | <0.001 | 8614 (43.4%) | 859 (34.2%) | <0.001 | |
| Chills | 101 (0.5%) | 7 (0.2%) | 0.021 | 100 (0.5%) | 8 (0.3%) | 0.206 | |
| Cough | 10103 (52.7%) | 1466 (46.2%) | <0.001 | 10605 (53.4%) | 964 (38.3%) | <0.001 | |
| Respiratory distress | 8562 (44.6%) | 1794 (56.6%) | <0.001 | 8649 (43.6%) | 1707 (67.9%) | <0.001 | |
| Sore throat | 142 (0.7%) | 13 (0.4%) | 0.038 | 150 (0.8%) | 5 (0.2%) | 0.002 | |
| Anorexia | 1372 (7.2%) | 97 (3.1%) | <0.001 | 1329 (6.7%) | 140 (5.6%) | 0.031 | |
| Dizziness | 565 (2.9%) | 32 (1.0%) | <0.001 | 569 (2.9%) | 28 (1.1%) | <0.001 | |
| Anosmia | 307 (1.6%) | 22 (0.7%) | <0.001 | 311 (1.6%) | 18 (0.7%) | 0.001 | |
| Dysgeusia | 191 (1.0%) | 28 (0.9%) | 0.551 | 207 (1.0%) | 12 (0.5%) | 0.007 | |
| Headache | 1115 (5.8%) | 75 (2.4%) | <0.001 | 1147 (5.8%) | 43 (1.7%) | <0.001 | |
| Myalgia | 4502 (23.5%) | 676 (21.3%) | 0.008 | 4784 (24.1%) | 394 (15.7%) | <0.001 | |
| Chest pain | 598 (3.1%) | 44 (1.4%) | <0.001 | 570 (2.9%) | 72 (2.9%) | 0.98 | |
| Abdominal pain | 409 (2.1%) | 28 (0.9%) | <0.001 | 408 (2.1%) | 29 (1.2%) | 0.002 | |
| Nausea | 963 (5.0%) | 88 (2.8%) | <0.001 | 966 (4.9%) | 85 (3.4%) | 0.001 | |
| Vomiting | 912 (4.8%) | 79 (2.5%) | <0.001 | 906 (4.6%) | 85 (3.4%) | 0.007 | |
| Gastrointestinal bleeding | 5 (0.0%) | 3 (0.1%) | 0.059 | 7 (0.0%) | 1 (0.0%) | 0.911 | |
| Diarrhea | 713 (3.7%) | 59 (1.9%) | <0.001 | 716 (3.6%) | 56 (2.2%) | <0.001 | |
| Convulsion | 76 (0.4%) | 24 (0.8%) | 0.005 | 72 (0.4%) | 28 (1.1%) | <0.001 | |
| Loss of consciousness | 701 (3.7%) | 381 (12.0%) | <0.001 | 409 (2.1%) | 673 (26.8%) | <0.001 | |
| Paresis | 77 (0.4%) | 15 (0.5%) | 0.559 | 78 (0.4%) | 14 (0.6%) | 0.227 | |
| Paralysis | 40 (0.2%) | 10 (0.3%) | 0.238 | 34 (0.2%) | 16 (0.6%) | <0.001 | |
| Path to diagnosis | |||||||
| Contact with a confirmed case of COVID-19 |
5449 (28.4%) | 848 (26.7%) | 0.054 | 5496 (27.7%) | 801 (31.9%) | <0.001 | |
| Diagnosis | <0.001 | <0.001 | |||||
| Clinical Manifestation | 5376 (28.0%) | 518 (16.3%) | 555 (28.0%) | 343 (13.6%) | |||
| PCR Positive | 11542 (60.2%) | 2325 (73.3%) | 11967 (60.3%) | 1900 (75.6%) | |||
| Positive PCR and Abnormal CT | 2267 (11.8%) | 328 (10.3%) | 2324 (11.7%) | 271 (10.8%) | |||
| Ward | <0.001 | <0.001 | |||||
| ICU | 2332 (12.2%) | 1109 (35.0%) | 2036 (10.3%) | 1405 (55.9%) | |||
| Isolation | 6714 (35.0%) | 585 (18.4%) | 6843 (34.5%) | 456 (18.1%) | |||
| General | 10139 (52.8%) | 1477 (46.6%) | 10963 (55.3%) | 653 (26.0%) | |||
Note: Except age, the other variables are presented as n(%). Abbreviations: CT: computed tomography scan; EMS: emergency medical services; ICU: intensive care unit; P: p-value; PCR: polymerase chain reaction; SD: standard deviation;
The results of multilevel univariate simple Cox, multilevel univariate multiple Cox, and multilevel joint models are shown in Table 2. The joint approach takes the significant association between the two response variables into account. The covariance between the random effects and standard deviation for the multilevel Cox and logistic regression random effects were 1.98 (standard error=0.38), 2.25 (standard error=0.54), and 1.19 (standard error=0.05), respect-tively. An average association of 74% was found between the random effects of the two sub-models.
Table 2. The results of multilevel univariate simple Cox, multilevel univariate multiple Cox and multilevel joint models assessing the impact of variables on in-hospital mortality
| Variables | Univariate Simple | Univariate Multiple | Multivariate Multiple | |||
|---|---|---|---|---|---|---|
| HR (95% CI) | P | HR (95% CI) | HR (95% CI) | |||
| Demographics | ||||||
| Age | 1.00 (0.14-7.15) | <0.001 | 1.00 (0.14-1.14) | 1.002 (1.001-1.002) | ||
| Female Gender | 0.87 (0.15-4.87) | 0.001 | 0.90 (0.15-5.38) | 0.91 (0.84-0.99) | ||
| Comorbidity | ||||||
| Asthma | 0.96 (0.14-6.27) | 0.781 | ||||
| Other chronic lung diseases | 1.14 (0.12-10.75) | 0.228 | ||||
| Chronic kidney disease | 1.47 (0.08-26.46) | <0.001 | 1.27 (0.10-15.61) | 1.33 (1.11-1.60) | ||
| Chronic liver disease | 1.46 (0.08-25.99) | 0.088 | 1.26 (0.10-15.17) | 1.31 (0.84-2.05) | ||
| Hypertension | 1.38 (0.09-20.63) | <0.001 | 1.07 (0.131-8.87) | 1.03 (0.91-1.16) | ||
| Diabetes | 1.27 (0.10-15.29) | <0.001 | 1.02 (0.14-7.56) | 1.01 (0.90-1.14) | ||
| Heart disease | 1.50 (0.08-28.47) | <0.001 | 1.19 (0.11-12.35) | 1.22 (1.08-1.37) | ||
| Cancer | 1.44 (0.08-24.57) | <0.001 | 1.76 (0.05-56.59) | 1.93 (1.57-2.37) | ||
| Drug abuse | 1.83 (0.05-66.05) | 0.001 | 1.09 (0.13-9.37) | 0.98 (0.68-1.40) | ||
| Nervous system diseases | 1.11 (0.12-9.93) | 0.440 | ||||
| Pregnancy | 0.21 (0.14-0.33) | 0.008 | 0.34 (0.17-0.66) | 0.35 (0.11-1.09) | ||
| Signs/Symptoms | ||||||
| Asymptomatic | 0.90 (0.15-5.27) | 0.565 | ||||
| Fever | 0.72 (0.17-2.98) | <0.001 | 0.88 (0.15-5.00) | 0.90 (0.83-0.98) | ||
| Chills | 0.72 (0.17-2.98) | 0.359 | ||||
| Cough | 0.62 (0.18-2.08) | <0.001 | 0.83 (0.16-4.20) | 0.82 (0.75-0.89) | ||
| Respiratory distress | 2.00 (0.04-101.59) | <0.001 | 1.47 (0.08-26.69) | 1.41 (1.29-1.55) | ||
| Sore throat | 0.52 (0.18-1.43) | 0.143 | ||||
| Anorexia | 0.97 (0.14-6.60) | 0.776 | ||||
| Dizziness | 0.54 (0.18-1.59) | 0.001 | 0.74 (0.17-3.18) | 0.77 (0.52-1.12) | ||
| Anosmia | 0.81 (0.16-3.97) | 0.376 | ||||
| Dysgeusia | 0.66 (0.18-2.44) | 0.158 | ||||
| Headache | 0.46 (0.18-1.16) | <0.001 | 0.65 (0.18-2.38) | 0.65 (0.47-0.89) | ||
| Myalgia | 0.76 (0.17-3.41) | <0.001 | 0.98 (0.14-6.85) | 1.00 (0.89-1.11) | ||
| Chest pain | 1.28 (0.10-15.86) | 0.037 | 1.43 (0.08-24.09) | 1.44 (1.13-1.84) | ||
| Abdominal pain | 0.75 (0.17-3.30) | 0.131 | ||||
| Nausea | 0.85 (0.16-4.48) | 0.138 | ||||
| Vomiting | 0.81 (0.16-4.04) | 0.066 | 0.97 (0.14-6.61) | 1.12 (0.89-1.41) | ||
| Gastrointestinal bleeding | 1.51 (0.07-29.77) | 0.676 | ||||
| Diarrhea | 0.78 (0.17-3.63) | 0.07 | 0.98 (0.14-6.74) | 1.05 (0.79-1.39) | ||
| Convulsion | 1.40 (0.09-21.68) | 0.078 | 0.70 (0.17-2.79) | 0.71 (0.48-1.05) | ||
| Loss of consciousness | 5.46 (0.00-12.25) | <0.001 | 3.33 (0.00-12.15) | 3.42 (3.10-3.78) | ||
| Paresis | 1.20 (0.11-12.57) | 0.498 | ||||
| Paralysis | 2.68 (0.01-510.91) | <0.001 | 1.40 (0.09-22.23) | 1.39 (0.84-2.30) | ||
| Path to diagnosis | ||||||
| Contact with a confirmed case of COVID-19 | 1.13 (0.12-10.51) | 0.003 | 1.01 (0.14-7.31) | 0.95 (0.87-1.04) | ||
| Diagnostic findings | ||||||
| Clinical manifestation | Ref | |||||
| Positive PCR | 1.45 (0.08-25.30) | <0.001 | 1.33 (0.09-18.20) | 1.19 (1.05-1.34) | ||
| Positive PCR and abnormal Chest CT | 1.30 (0.10-16.56) | 0.001 | 1.50 (0.08-28.42) | 1.33 (1.13-1.56) | ||
| Ward | ||||||
| ICU | Ref | |||||
| Isolation | 0.29 (0.16-0.53) | <0.001 | 0.43 (0.18-0.99) | 0.36 (0.32-0.40) | ||
| General | 0.25 (0.15-0.42) | <0.001 | 0.37 (0.18-0.76) | 0.35 (0.32-0.39) | ||
Abbreviations: CI: confidence interval; CT: computed tomography scan; H.R.: hazard ratio; ICU: intensive care unit; P: p-value; PCR: polymerase chain reaction; Ref: reference;
The predictors of EMS utilization based on the multilevel univariate simple logistic, multilevel univariate multiple logistic, and the multilevel joint models are shown in Table 3. The odds of EMS use increased by 0.3% per year increase in age and was lower for women by 8%. Comorbidities such as drug abuse (OR 2.41; 95%CI 1.63-3.54), chronic lung diseases (OR 1.62; 95%CI 1.26-2.08), asthma (OR 1.47; 95%CI 1.11-1.94), cancer (OR 1.60; 95%CI 1.17-2.20), and diabetes (OR 1.21; 95%CI 1.06-1.37) were independent predictors of EMS utilization. After adjustment for covariates, headache (OR 0.65; 95%CI 0.50-0.85), abdominal pain (OR 0.53; 95%CI 0.36-0.80), and vomiting (OR 0.74; 95%CI 0.55-0.98) were associated with lower odds of EMS activation, while severe presentations such as respiratory distress (OR 1.21; 95%CI 1.11-1.32), or loss of consciousness (OR 2.57; 95%CI 2.21-2.98) were associated with higher EMS use. Positive PCR cases and those with both positive PCR and CT had 2.5 and 1.88 times higher odds of EMS use than those diagnosed only based on clinical manifestation.
Table 3. Factors associated with EMS utilization based on the multilevel univariate simple logistic, multilevel univariate multiple logistic and multilevel joint models
| Variables | Univariate Simple | Univariate Multiple | Joint Multiple | |
|---|---|---|---|---|
| OR (95% CI) | P | OR (95% CI) | OR (95% CI) | |
| Demographics | ||||
| Age | 1.008 (1.006-1.01) | <0.001 | 1.001 (0.99-1.003) | 1.003 (1.001-1.005) |
| Female Gender | 0.87 (0.80-0.94) | 0.001 | 0.93 (0.86-1.02) | 0.91 (0.84-0.99) |
| Comorbidity | ||||
| Asthma | 1.43 (1.08-1.88) | 0.010 | 1.47 (1.10-1.96) | 1.47 (1.11-1.94) |
| Other chronic lung diseases | 1.67 (1.31-2.13) | <0.001 | 1.48 (1.14-1.92) | 1.62 (1.26-2.08) |
| Chronic kidney disease | 1.05 (0.84-1.31) | 0.659 | ||
| Chronic liver disease | 0.79 (0.42-1.47) | 0.461 | ||
| Hypertension | 1.22 (1.07-1.38) | 0.002 | 0.98 (0.84-1.14) | 1.00 (0.87-1.16) |
| Diabetes | 1.32 (1.18-1.49) | <0.001 | 1.20 (1.05-1.37) | 1.21 (1.06-1.37) |
| Heart disease | 1.20 (1.05-1.37) | 0.006 | 0.96 (0.83-1.11) | 1.05 (0.91-1.21) |
| Cancer | 1.83 (1.34-2.51) | <0.001 | 1.54 (1.10-2.13) | 1.60 (1.17-2.20) |
| Drug abuse | 2.94 (2.03-4.26) | <0.001 | 2.15 (1.44-3.21) | 2.41 (1.63-3.54) |
| Nervous system diseases | 1.44 (1.06-1.95) | 0.019 | 1.00 (0.72-1.39) | 1.07 (0.78-1.48) |
| Pregnancy | 0.35 (0.20-0.62) | <0.001 | 0.57 (0.32-1.02) | 0.57 (0.32-1.01) |
| Signs/Symptoms | ||||
| Asymptomatic | 1.10 (0.77-1.56) | 0.591 | ||
| Fever | 0.88 (0.81-0.96) | 0.003 | 0.99 (0.90-1.08) | 0.99 (0.91-1.08) |
| Chills | 0.63 (0.28-1.44) | 0.279 | ||
| Cough | 0.75 (0.69-0.81) | <0.001 | 0.83 (0.76-0.90) | 0.91 (0.81-1.08) |
| Respiratory distress | 1.50 (1.38-1.63) | <0.001 | 1.11 (1.01-1.22) | 1.21 (1.11-1.32) |
| Sore throat | 0.54 (0.29-1.00) | 0.051 | 0.65 (0.34-1.24) | 0.65 (0.35-1.19) |
| Anorexia | 0.49 (0.39-0.61) | <0.001 | 0.63 (0.50-0.80) | 0.88 (0.76-1.03) |
| Dizziness | 0.34 (0.23-0.48) | <0.001 | 0.57 (0.38-0.83) | 0.84 (0.69-1.00) |
| Anosmia | 0.53 (0.34-0.83) | 0.006 | 0.61 (0.37-1.01) | 0.68 (0.43-1.07) |
| Dysgeusia | 1.05 (0.69-1.59) | 0.805 | ||
| Headache | 0.44 (0.34-0.56) | <0.001 | 0.70 (0.54-0.90) | 0.65 (0.50-0.85) |
| Myalgia | 0.78 (0.71-0.86) | <0.001 | 0.95 (0.85-1.05) | 0.91 (0.82-1.01) |
| Chest pain | 0.59 (0.42-0.81) | 0.001 | 0.65 (0.47-0.90) | 0.82 (0.65-1.06) |
| Abdominal pain | 0.43 (0.29-0.64) | <0.001 | 0.58 (0.39-0.88) | 0.53 (0.36-0.80) |
| Nausea | 0.58 (0.46-0.73) | <0.001 | 1.04 (0.78-1.37) | 0.98 (0.74-1.30) |
| Vomiting | 0.54 (0.43-0.69) | <0.001 | 0.73 (0.55-0.99) | 0.73 (0.55-0.98) |
| Gastrointestinal bleeding | 4.21 (0.87-20.17) | 0.072 | 5.82 (1.05-32.25) | 4.43 (0.79-24.83) |
| Diarrhea | 0.66 (0.49-0.87) | 0.004 | 0.87 (0.64-1.17) | 0.87 (0.65-1.16) |
| Convulsion | 2.02 (1.22-3.32) | 0.006 | 1.19 (0.70-2.01) | 1.37 (0.81-2.32) |
| Loss of consciousness | 3.27 (2.84-3.78) | <0.001 | 2.00 (1.71-2.33) | 2.57 (2.21-2.98) |
| Paresis | 0.99 (0.53-1.84) | 0.98 | ||
| Paralysis | 1.93 (0.90-4.17) | 0.091 | 1.22 (0.55-2.71) | 1.26 (0.58-2.75) |
| Path to diagnosis | ||||
| Contact with a confirmed case of COVID-19 | 1.06 (0.96-1.16) | 0.203 | ||
| Diagnostic findings | ||||
| Clinical manifestation | Ref | |||
| Positive PCR | 2.74 (2.43-3.09) | <0.001 | 2.38 (2.10-2.71) | 2.50 (2.24-2.79) |
| Positive PCR and abnormal Chest CT | 1.88 (1.60-2.20) | <0.001 | 1.86 (1.58-2.20) | 1.88 (1.60-2.20) |
Abbreviations: CI: confidence interval; CT: computed tomography scan; ICU: intensive care unit; OR: odds ratio; P: p-value; PCR: polymerase chain reaction; Ref: reference;
The results of the multilevel joint model demonstrated the risk of death to be increased by 0.2% per year increase in age, and the female gender provided an 8.6% risk reduction of death. Among the comorbidities, the presence of chronic kidney disease, heart disease, and cancer increased the risk of death by 33% (95%CI 11%-60%), 31% (95%CI 8%-37%), and 93% (95%CI 57%-137%), respectively. After adjustment for covariates, presentation with general viral symptoms such as fever (HR 0.90; 95%CI 0.83-0.98), cough (HR 0.82; 95%CI 0.75-0.89), and headache (HR 0.65; 95%CI 0.47-0.89) was associated with lower hazard of death, whilst symptoms such as respiratory distress (HR 1.41; 95%CI 1.29-1.55), chest pain (HR 1.44; 95%CI 1.13-1.84), and loss of consciousness (HR 3.42; 95%CI 3.10-3.78) were associated with increased risk of mortality in hospital. Positive PCR cases and those with both positive PCR and CT had 1.19 and 1.32 times higher risk of death than those diagnosed only based on clinical mani-festation. Moreover, hospitalized cases in isolated and general wards have almost 65% less chance of death compared to those in ICU.
The mean and median survival time was longer for patients with COVID-19 who self-presented to the hospital (46.6 and 31 days, respectively) compared to cases who presented via ambulance (31.6 and 20 days, respectively). Kaplan-Meier curves showed lower survival from Covid-19 in those who presented with ambulance compared to their counterparts (log-rank test P<0.001, Figure 1).
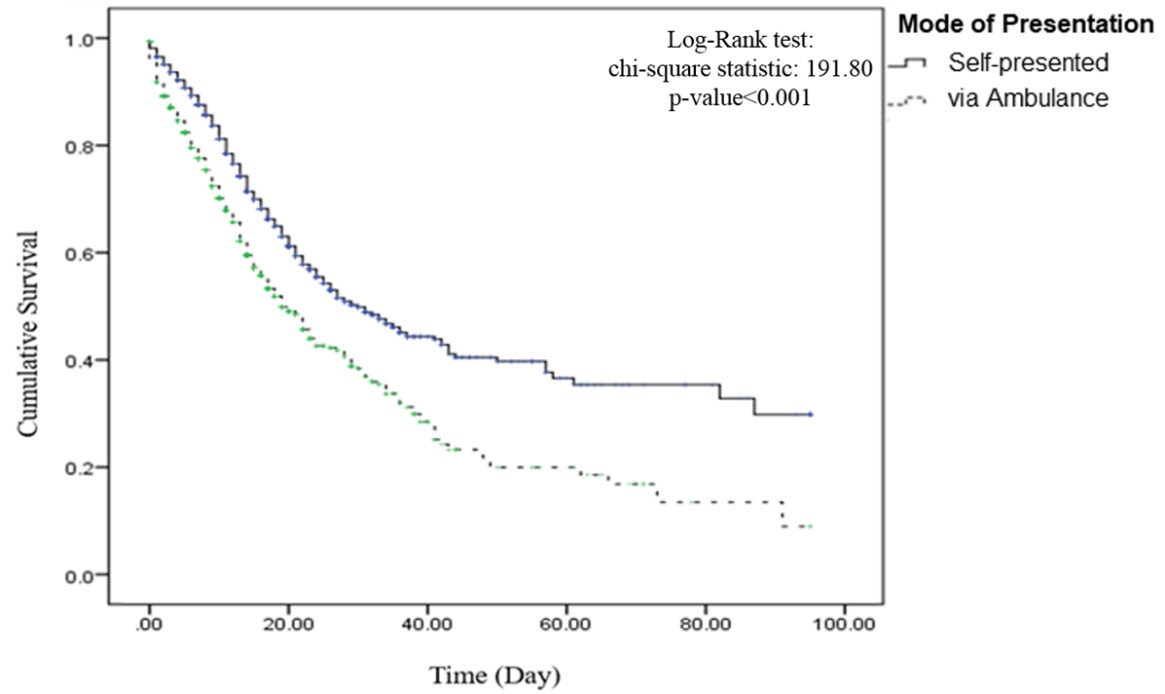
Figure 1. The Kaplan-Meyer survival curve for groups with different modes of hospital presentation
In this retrospective analysis of patients hospitalized with COVID-19 in the province of Khuzestan in southwestern Iran, we had several key findings: First, only one in seven patients presented to the hospital with an ambulance. Second, patients who presented with an ambulance had distinct clinical characteristics compared to those who self-presented. Third, multi-ple factors were found to predict the EMS utilization and in-hospital mortality in patients hospitalized with COVID-19, and those features can be leveraged to distinguish those at higher risk of adverse outcomes from COVID-19 infection.
In the current study, presentation via ambulance was a harbinger of poorer in-hospital outcomes among patients hospitalized with COVID-19. This observation may not be specific to COVID-19, as the phenomenon was previously reported for many other disease conditions as well (7-10).
The pandemic has changed care delivery worldwide, across its spectrum from EMS to emergency department to inpatient/ICU care. EMS protocols needed to be adapted, as the existing protocols were insufficient for dealing with issues such as resuscitating out-of-hospital cardiac arrest in cases with suspected COVID-19, etc. (11-15). The EMS use remained stable (16) or increased in some jurisdictions (17-19), where additional roles were assigned to the EMS as a part of the pandemic response, such as home testing, etc.
However, numerous studies from a wide variety of countries reported decreased EMS calls and dis-patches, at least in the initial phases of the pandemic. In line with an earlier preliminary report from the United States (U.S.) (20), Satty et al. reported a 26.5% decrease in the EMS responses for the March-May 2020 period compared to the corresponding 2-month periods in 2016-2019 in a region with the low-mode-rate burden of COVID-19 infection in the U.S. (21). Similarly, the EMS calls significantly decreased in Canada since the beginning of the pandemic in 2020 compared to the 2016–2019 period (22).
A US survey found that people were abstaining from calling EMS due to the fear of contracting COVID-19, regardless of the severity of their health condition (23), making it important to study how patients who activated EMS differed from those who self-presented in terms of demographic and clinical characteristics.
Although there has been studies exploring the predictors of poorer in-hospital outcome in patients with COVID-19, there is a paucity of studies investi-gating the factors associated with EMS utilization in the pandemic setting with considering its impact on in-hospital outcomes. To do so, we used a joint modeling approach in which EMS utilization and the time to in-hospital mortality were combined as the outcomes of COVID-19, and the impact of several demographic and clinical variables on the response variables was investigated.
In our study, older age and male sex were respon-sible for a higher ratio of EMS use and in-hospital death. Previous studies from different regions have reported higher age in patients who die in hospital due to COVID-19 compared to those who survive (24-34), and older age and male sex have been independent predictors of mortality (31, 34-38). Besides increased comorbidities, the loss of control over viral replication due to age-related deficiencies in lymphocyte active-ties and the dysregulation of type 2 cytokine response are some purported contributing factors to the prognostic impact of age in COVID-19 infection (24). Furthermore, sex differences in innate immunity and the effect of steroidal hormones could be the underlying mechanism behind risk protection in women (24).
Several studies have shown increased adverse outcomes in the setting of COVID-19 in patients with comorbidities (31, 34, 37-41). In our study, comor-bidities such as asthma, other chronic lung diseases, diabetes, cancer, and drug abuse were strongly associated with EMS utilization, and the presence of chronic kidney disease, heart disease, and cancer was associated with in-hospital mortality in patients hospitalized with COVID-19.
Patients with respiratory distress and loss of cons-cioussness were more likely to present to the hospital via ambulance, and symptoms such as respiratory distress, chest pain, and loss of consciousness significantly predicted death following COVID-19 infection. This was in line with previous reports from China showing the symptoms of dyspnea, chest tightness, and loss of consciousness to be more common among deceased patients compared to those who survived (26). Unlike our study, chest pain was not a predictor of mortality in some previous studies (29). A decreased level of consciousness is among the presenting features of COVID-19 and can be attributed to a variety of etiologies, from hypoxia to neurologic issues. In our study, loss of consciousness was present in ~10% of patients and was three times more common in those who died in the hospital compared to those who survived. In keeping with the study of Trigo et al., the headache was an independent predictor of lower mortality risk in COVID-19 patients (42).
Some of the clinical predictors mentioned in the current study are similar to features reported from SARS or MERS (43, 44). This could be a good reminder that COVID-19 is not going to be our last epidemic or pandemic, so whilst we are trying to manage the current pandemic, we should learn on how to prepare ourselves for the future ones. These factors can help in identifying those at increased risk of poor outcomes and can inform current and future pandemic/-epidemic responses.
We considered the multilevel structure of the data in the modeling procedures to achieve estimations with the least bias. Regarding the confidence intervals for the parameter estimations, it is shown that the joint modeling approach results in narrower intervals. In other words, the standard error of the estimation in the joint model is shown to be lower than those of univariate multiple and simple methods. Therefore the estimated parameters are more reliable. Litera-ture has proven that ignoring the multilevel structure negatively affects the model's performance, the classification of individuals into response variable classes, and the standard errors for parameter estimates (45). It has been argued that the use of the joint modeling approach reduces the bias in the estimation of fixed-effect parameters and variance components, decreases the mean square of errors, and increases the efficiency of parameter estimation. It has been shown that when there is a positive/negative association between the time to event outcome and the binary response variable, using separate models yields to less precise estimation and lower power in comparison with the joint modeling (6).
Several strengths and limitations are noteworthy. The database is a large multi-center database from an entire province in a country highly affected by the COVID-19 pandemic. As mentioned above, the joint modeling used in this study yields a more accurate estimation of the effect size for the effect of different covariates on the outcomes of interest than studying those outcomes separately. The use of multilevel modeling takes into account the impact of clusters of care (centers and hospitals) and their potential heterogeneity in providing health care services. We lacked data on some predictors of outcomes, including the laboratory results, baseline medications, and COVID-19-related therapies. However, all patients in this cohort were treated according to the national COVID-19 treatment protocols. We did not have data on distance from the patients’ residence to the health facility and cannot rule that out as a potential confounder of the patients’ EMS utilization decision (9, 46). The database is limited to those admitted to the hospital due to COVID-19 infection, so the results may not be generalizable to the patients with COVID-19 infection who do not present to the hospital.
Using the joint modeling approach, several demo-graphic and clinical factors were found to predict the EMS utilization and in-hospital mortality in patients hospitalized with COVID-19. Controlling for the predictors of EMS utilization in COVID-19 infection may significantly increase the survival time and the survival probability of patients.
The authors would like to thank the vice-chancellor of the Islamic Republic of Iran’s Ministry of Health and Medical Education for providing the database for this analysis.
This research did not receive any specific grant from any agency in the public, commercial, or not-for-profit sector.
The Ethics Committee of Ahvaz Jundishapur University of medical sciences approved the study protocol under the code: I.R.AJUMS.REC.1400.200.
The datasets used and/or analyzed during the current study would be available from the corresponding author on reasonable request.
PA & SGH: Conception and design of the research; Statistical analysis; Interpretation of data; Writing of the manuscript. AS & J.Z.: Conception and design of the study; Acquisition of data. NS: Interpretation of data; Writing of the manuscript. All authors approved the final version of the article for submission.
Ethical approval to perform this study was obtained by the Ethical Review Board of the Ahvaz Jundishapur University of Medical Sciences.
Conflicts of Interest
The authors declared no competing interests.
Received: 2021/08/4 | Accepted: 2021/10/9 | ePublished: 2021/12/8
| Rights and permissions | |
 |
This work is licensed under a Creative Commons Attribution-NonCommercial 4.0 International License. |
Copyright Policy
Iranian Journal of Medical Microbiology by Farname is licensed under CC BY-NC 4.0![]()
![]()
![]()
