


![]()
![]()
![]()
BibTeX | RIS | EndNote | Medlars | ProCite | Reference Manager | RefWorks
Send citation to:
URL: http://ijmm.ir/article-1-2063-en.html


2- Department of Mathematical Sciences, Cenderawasih University, Papua, Indonesia
3- Department of Radiology, DR. Kariadi Hospital, Semarang, Indonesia
Many diseases that threaten human life come from bacteria, parasites, and viruses (1-3). Furthermore, these bacteria, parasites, and viruses can be transmitted through animals (4-6). One of them is malaria. Malaria is a disease that threatens human life. It is caused by a parasite transmitted to humans by biting an infected female Anopheles mosquito (7). The transmission of this disease can be prevented and cured. There are five species of parasites that cause malaria in humans. Two parasitic species, namely Plasmodium falciparum and Plasmodium vivax, are the most significant threats (8-10).
The risk of malaria will affect around half of the world's population by 2020. Sub-Saharan Africa has the greatest number of cases and fatalities. In the World Health Organization (WHO) regions of Southeast Asia, the Eastern Mediterranean, the Western Pacific, and the Americas, several cases and fatalities were reported. In 2020, there will likely be 241 million instances of malaria and 627,000 fatalities, according to estimates. a WHO Globally, the burden of malaria is disproportionately high throughout the African continent (7, 11). The percentage of malaria cases and fatalities in the region by 2020 will reach 95% and 96%, respectively. The WHO Africa Region predicts that by 2020, children under the age of five will account for about 80% of all malaria deaths. The top cause of death in the world is malaria. Malaria is a disease that affects the tropical and subtropical regions of the earth between 60 degrees north and 40 degrees south. Over 2.3 billion individuals, or 41% of the world's population, are susceptible to malaria. Between 300 million and 500 million people contract malaria annually, which results in 1.5 million to 2.7 million fatalities (12, 13).
Malaria has been successfully eradicated worldwide. In this time, malaria prevention and control initiatives have helped save at least 1.1 million lives (14). In high-epidemic areas, it is still challenging for people to receive effective malaria prevention, diagnosis, and treatment. Currently, funding is available for initiatives to lower malaria incidence and prevalence globally (3, 15). To create an efficient and effective malaria control program, it is essential to comprehend the efficacy and effectiveness of control methods. Malaria mathematical modeling enables precise forecasting of the program's utilization of control methods (16).
In the last ten years, articles related to mathematical models of malaria transmission involving human and mosquito populations have been discussed in (14, 17-20). The mathematical model of malaria transmission continues to be developed, involving the optimal control strategy discussed in (21-23). Control of malaria transmission can also be done by analyzing the effect of each parameter in the model, as discussed in (8, 24, 25). The mathematical model of malaria transmission discussed in this article adopts the model from Xing et al. (26-29). The discussion in (30, 31) studies focuses solely on the model's backward bifurcation and the equilibrium point's global stability; no attention is paid to the sensitivity analysis of any individual model parameter. The sensitivity of each parameter in the model influences the precision of future predictions of malaria transmission. Finding the malaria transmission model's most important parameters requires conducting a sensitivity study. When developing ways to prevent malaria transmission, these factors might be utilized as a guide. Consequently, the objective of this discussion is to assess the sensitivity index of the mathematical model of malaria transmission from (26).
Mathematical modeling for the problem of malaria transmission is a theoretical study. The discussion in this article is focused on analyzing the sensitivity of the malaria transmission model. The method used in the discussion of this article is a theoretical study method with references from several reputable international articles. The flow of discussion in this article begins with constructing a malaria transmission model, determining the equilibrium point, and determining the basic reproduction number and the sensitivity index of each parameter in the model. Finally, a numerical simulation is given to qualitatively review the influence of the most dominant parameter changes on the human population infected with malaria.
 , and the number of humans infected with malaria at the time
  is denoted by
  , and the number of humans who are cured at the time t is denoted by
  . If the number of the individuals population at time t is denoted by
  , then
  . The SI (Susceptible-Infected) deterministic model is formulated for the female mosquito compartment (32). The proportion of vulnerable adult female mosquitoes and those that can be infected with plasmodium parasites at time t is denoted by
  , and the number of adult female mosquitoes infected with plasmodium parasites at time t is denoted by
  . If the population of adult female mosquitoes at the time t is denoted by
  , then
  The infection period of the adult female mosquito in this model is assumed to last until her death because her life cycle is relatively short. Adult female mosquitoes compete for food and a place to lay eggs because the resources associated with mosquito reproduction are limited. It is expected that the mosquito birth rate is higher than the death rate. Immunity to malaria does not occur permanently in some people. Figure 1 shows a flow chart for formulating a mathematical model of malaria transmission. The mathematical model of malaria transmission is formulated in a system of nonlinear ordinary differential equations as follows (26).
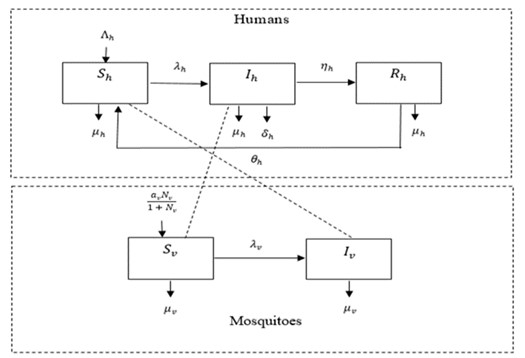
Figure 1. Schematic diagram of SIR model in human population and SI model in mosquito population


with


The total population of adult female mosquitoes fulfills the following equation

Thus, System 1 is equivalent to the following equation


All parameters in System 2 are positive and
 . The description of all parameters of System (2) is given in Table 1.
The solution of System (2), which does not vary over time, is the equilibrium point of System (2) (constant solution). Suppose
 is the equilibrium point of System 2, then:


The equilibrium point has a biological meaning that depends on
 . If humans and adult female mosquitoes are not infected with malaria in the population
  , then this state is said to be disease free. On the other hand, if in the population there are humans and adult female mosquitoes infected with malaria
  , then this condition is called endemic. In System 3, for the case of
  there is one disease-free equilibrium point, namely
  .
.The basic reproduction number is a threshold to determine whether malaria endemic will occur in the population. The following will determine the basic reproduction number using the next-generation matrix method (30).
Model (2) has two infected states i.e.
 and
and  So we have the following subsystem,

With
 .
.If for example
 where
where  is a transpose, then the subsystem can be written as
with

So that the Jacobian matrix
 and
and  di
di  is obtained as follows
Thus, the basic reproduction number of System 2 based on the following generation matrix method (30) is

If
 dan
dan  , then System 3 obtains the endemic equilibrium point
  with
with


 is the positive root of the equation
with


with


The value of
 in equation (4) depends on
  so that to determine the endemic equilibrium point, it can be reviewed based on the following two cases:
- If
 , then
  consequently
- If
 , then there is no endemic equilibrium point,
 - If
 , then there is no endemic equilibrium point,
 - If
 , then for
  there is no endemic equilibrium point; for ∆=0, there is one endemic equilibrium point; for
  , there are two endemic equilibrium points.
If  then
then  consequently, in System (2), there is one endemic equilibrium point.
Table 1 shows all the basic parameter values used in System 2. The parameter value consists of two cases, namely: low transmission
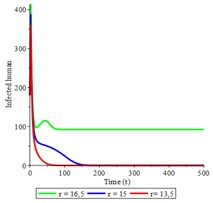
Figure 2. Dynamical Population of infected human for the different values of an individual mosquito's average number of bites on all human hosts parameter
The parameters that have a significant impact on the baseline reproduction rate and should be the focus of the intervention approach are also identified through this research. A sensitivity index is typically used to measure the proportional change in a variable when a parameter changes. The ratio of the relative change in the variable to the relative change in the parameter is known as the sensitivity index of a variable with respect to that parameter. The partial derivative can be used to determine the sensitivity index when the variable is a differential function with respect to a parameter. The sensitivity index is described in the sentences that follow. Definition. The sensitivity index of a variable
This definition means that the higher the sensitivity index, the higher the impact on the measured variable and vice versa. Sensitive parameters must be calculated with caution since even tiny changes will result in significant quantitative changes. In the following, the calculation of the sensitivity index of the basic reproduction number is applied to the parameter
The sensitivity index formulation of the other parameters can be determined analogously as above. The index of sensitivity of the reproduction number to different parameters in System (1) is presented in Table 2. The parameters with a high to low impact on the basic reproduction number are displayed in Table 2 by the sensitivity index. In general, two parameters have the most impact on the basic reproduction number. These parameters include an individual mosquito's average number of bites on all human hosts
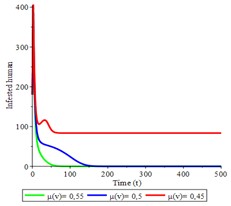
Figure 3. Dynamical Population of infected human
Parameters with a positive value of the sensitivity index showed a positive significance in increasing the basic reproduction number. If the value of the
Table 1. The basic values of the parameters used in the malaria transmission model (2)
| Parameter | Description | Baseline Low | Baseline High |
| The likelihood of transmission increases with each bite of a vulnerable mosquito. | 0.2 | 0.2 | |
| The likelihood of transmission per bite to a vulnerable individual | 0.24 | 0.3 | |
| An individual mosquito's average number of bites on all human hosts | 15 | 21 | |
| The number of people hired on average | 50 | 21 | |
| The number of humans who die naturally | 0.02 | 0.12 | |
| The proportion of people who die from disease | 0.5 | 0.5 | |
| Humans' recuperation rates | 0.07 | 0.7 | |
| The highest value of the viable mosquito egg recruitment rate | 20 | 10 | |
| The number of mosquitoes who die naturally | 0.5 | 0.8 | |
| The rate at which humans lose their immune | 0.5 | 0.5 |
The result is that the basic reproduction number increases. Table 2 shows an individual mosquito's average number of bites on all human hosts
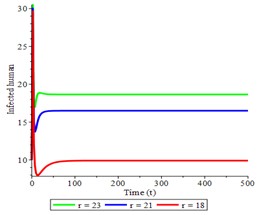
Figure 4. Dynamical Population of infected human
This is because the sensitivity index of the parameter
Table 2. Sensitivity index of basic reproduction number for each parameter in System (1)
| Parameter | Sensitivity Index | |
| Low transmission | High transmission | |
| 0.5 | 0.5 | |
| 0.5 | 0.5 | |
| 1 | 0.99 | |
| -0.5 | -0.5 | |
| 0.24 | 0.45 | |
| -0.16 | -0.19 | |
| -0.08 | -0.26 | |
| 0.52 | 0.54 | |
| -1.02 | -1.04 | |
| 0 | 0 | |
The numerical simulation is shown in Figure 2. If the parameter value
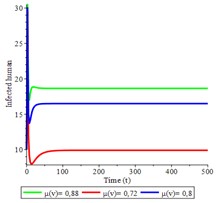
Figure 5. Dynamical Population of infected human
The sensitivity index shows that the parameter of an individual mosquito's average number of bites on all human hosts
None.
Conflicts of Interest
The authors declared no competing interests.
This article was written by Saiful Marom, Joko Harianto and Etty Kurniawati. Saiful Marom and Joko Harianto contributed to mathematical modeling, and Etty Kurniawati contributed to malaria transmission. All authors have read and approved the final published version of the article.
None.
Received: 2023/06/7 | Accepted: 2023/09/16 | ePublished: 2023/11/29
| Rights and permissions | |
 |
This work is licensed under a Creative Commons Attribution-NonCommercial 4.0 International License. |
Copyright Policy
Iranian Journal of Medical Microbiology by Farname is licensed under CC BY-NC 4.0![]()
![]()
![]()
