


![]()
![]()
![]()
BibTeX | RIS | EndNote | Medlars | ProCite | Reference Manager | RefWorks
Send citation to:
URL: http://ijmm.ir/article-1-1584-en.html


 , Stanley Irobekhian Reuben Okoduwa 2, Shaibu Ahmed Munirat3 , Iquo Bassey Otu-Bassey4 , Abdullahi Bashir3 , Otori Mercy Onyiyioza3 , Idongesit Asuquo Enang5 , Ugochi Judith Okoduwa5
2- Directorate of Research and Development, Nigerian Institute of Leather and Science Technology, Zaria, Nigeria , siroplc@gmail.com
3- Department of Microbiology, Ahmadu Bello University, Zaria, Nigeria
4- Department of Medical Laboratory Sciences, University of Calabar, Calabar, Nigeria
5- Industrial and Environmental Pollution Department, National Research Institute for Chemical Technology, Zaria, Nigeria
Enteric fever (EF), commonly called typhoid fever (TF) is a systemic infectious illness triggered by Salmonella Typhi and Salmonella Paratyphi A, which if left untreated could cause substantial ill health and death. The disease causes serious public health challenges, with approximately 12,000,000 to 27,000,000 cases annually (1, 2). The estimated death varies between 129,000 to 223,000 annually (3, 4) with overwhelming affliction in poor countries, with a worldwide projection of 11.9 million cases and 120 000–220 000 mortality yearly (5, 6). The prevalence of TF has been reported to be high in preschool children and infants (6-9). In Africa, it has been observed that the burden of the disease is significantly high (6, 10).
Lack of suitable diagnostic tests, as well as effective antibiotic treatment, could result in TF death (11). With respect to the absence of decisive diagnostic protocols, the disease could lead to fatal complications such as intestinal perforations (12). The diagnostic accuracy of TF is a major challenge. The gap in TF diagnosis has led to under-diagnosis, imprecise disease burden estimates, inaccurate, and over-diagnosis that could result in inappropriate and excessive intake of antibiotics (13, 14). Various diagnostic techniques have been employed, including blood culture and bone marrow which were recommended to be gold-standard diagnostic tests (15, 16). Bone marrow techniques are the most sensitive and specific assay for enteric fever, though invasive with medical complications and required skilled personnel and expert equipment (17). Blood culture is the most frequently used technique among culture-based methods (18). Blood and bone marrow culture sensitivity has been quantified at 40-80% and >80% respectively (17, 18).
Rapid and accurate enteric fever diagnosis is significant and could reduce mortality, and ill health and control the spread of the ailment (19-23). Widal test is mostly utilized because it is readily available and affordability but lacks sensitivity and specificity and is not very reliable (24-27). However, this cheap and quick Widal test is the reason for the extensive report on typhoid fever prevalence in different regions of Nigeria (14). Numerous serology-based rapid assays for enteric fever are accessible, such as TUBEX, Typhidot, and Multi-Test Dipstick. Enzyme-linked immunosorbent assay (ELISA) and hemagglutination are serological tests that are utilized for Salmonella enterica serova Typhi O and H antigens with poor sensitivity and specificity (28). Research findings for the best enteric fever diagnostic techniques are being carried out by many research groups globally, with elusive results (29). Novel diagnostic techniques for enteric fever are in progress that could mitigate this deficit. New point-of-care technologies such as Loop-Mediated Isothermal Amplification, rapid magneto-DNA nanoparticle assay, Polymerase Chain Reaction (PCR) and Typhidot have been established (30-34). Emerging typhoid diagnostic techniques based on protein biomarkers, metabolite biomarkers, nucleic acid biomarkers and genomics are among the utmost examined methods, and are presented in the subsequent section. Researchers have searched for specific biomarkers for acute typhoid fever patients, enabling scholars to distinguish patients with other ailments as well as people that are hale and hearty.
The use of gold-standard tests with imperfect diagnostic accuracy could bring about newer and better techniques (35). The development of a CRS is an alternative technique to improve accuracy due to the lack of a perfect reference standard test (36). CRS is the combination of more than one imperfect technique aimed at increasing diagnostic accuracy. The knowledge of sensitivity as well as specificity of formerly detected S. Typhi is significant in providing data and hence creating very accurate diagnostic techniques for enteric fever. Consequently, this study involved the evaluation of existing evidence concerning the sensitivity, specificity, as well as emerging diagnostic techniques of enteric fever. This study anticipated that the result will help to provide informative resources for researchers that want to improve enteric fever diagnostic tests. However, the finding proposed the adoption of harmonised CRS as a suitable standardized composite reference which would help to enhance assurance in the prevalence appraisals of enteric fever infections.
2.1. Research design
The research design was a quantitative method with a survey approach which involves five respective steps: identification of studies; selection of articles; quality assessment of studies; extraction of data; and data analysis. Relevant literature published between January 2010 and December 2021 were retrieved.
2.2. Search Strategy for Identification of Relevant Articles of Diagnostic Protocols of Typhoid Fever
An electronic search approach was used to find out articles in English that assessed enteric fever diagnostic protocols among humans. Published peer-reviewed articles on the diagnostic protocol for enteric fever were identified from Google scholar, PubMed, and MEDLINE databases. The search words were sensitivity or specificity of typhoid diagnosis, Typhidot test, biomarkers of typhoid fever and Widal test for trials in progress.
2.3. Search Outcome and Selection of Studies
In all, four hundred and thirty-two (432) articles were identified and screened (Figure 1). 379 articles were excluded after reviewing the articles based on the following: duplicates 99, misleading titles and abstract 105, articles without Widal and rapid diagnostic test 98, and articles that do not meet quality criteria 77. The data obtained from the chosen sources were gathered and summarized using detection assays, biological specimens, classification studies on typhoid fever diagnosis, year of publication, specificity and sensitivity
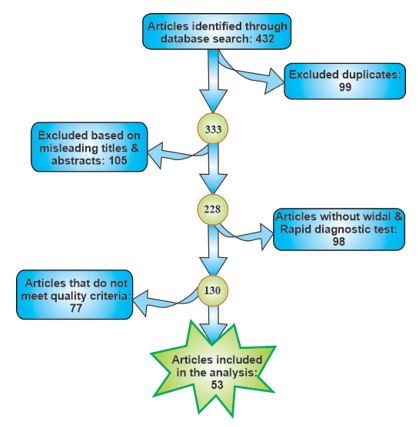
Figure 1. Flowchart of published peer-reviewed journals detected through databases and included in the analysis.
2.4 Inclusion and Exclusion Criteria
Studies in the English language were included without restrictions on the country, age, demographics, or time. Cross-sectional studies with paired comparative studies, prospective cohort studies, and retrospective studies were included. Also, Studies that reported on classifications of typhoid diagnosis were included. Studies that do not meet quality criteria were excluded.
2.5 Ethics Statement
Studies included were those that were given approval by an institutional ethics review committee and in addition obtained informed consent from all their participants. Ethics approval was not requisite for the present study as it was based on secondary data generated from primary sources.
2.6 Statistical Analysis
Microsoft Excel and Statistical Package for Social Science (SPSS) version 25.0 were used to enter data obtained using descriptive analysis. The results are presented as percentages. An independent sample t-test was utilized to find differences in the mean percentage specificity and sensitivity of diagnostic tests. P < 0.05 was used for the statistical significance level.
3.1. Characteristics of Diagnostic Protocols for Enteric Fever
Results of the synthesis collected in the literature review are presented in this section. Of the 432 searched articles, 53(12.3%) articles met the inclusion criteria with 13,036 participants (Table 1). Exactly 35 studies use the Widal test, 6 use TUBEX, 15 use Typhidot (Typhidot, Typhidot-M, and TyphiRapid-Tr02), 1 use Diazo test, 2 use Enterocheck WB®, 6 use PCR, 1 use ONSITE Typhoid Combo, 1 use Multi-test dipstick, and 2 use Panbio ELISA. Forty (40) studies used the gold standard for comparison. All of the diagnostic tests were developed to identify S. Typhi infection and Paratyphi. Six (6) studies utilized antibody detection. Lipopolysaccharides (LPS), distending toxin subunit B (CdtB), flagellin, hemolysin E (HlyE), and 50 kDa outer were the most commonly studied antigen. Many of the studies were done to detect antibodies presence using blood serum samples while few studies uses saliva (Table 3). The use of laboratory diagnosis is required to confirm typhoid fever. However, they are several diagnostic protocols for typhoid fever. (Table 2)
3.2. Enteric fever serological diagnosis
Kauffman–White classification is used for serological identification of Salmonella enterica serovars. The Widal test (WT) has a moderate average diagnostic accuracy in the diagnosis of TF, according to the study. The average sensitivity of 53.8% (Figure 2), average specificity of 55% (Figure 3), average PPV of 57.8% (Figure 4), and average NPV of 55.6% (Figure 5) were determined using the Widal test while 29.4%, 28%, 29.5%, and 27.8% was determined using Typhidot respectively. There was statistical evidence to demonstrate that there was a significant difference between the Widal test and Typhidot. The diagnostic accuracy of Widal was moderate compared to others. Lipopolysaccharides (LPS) O, VI, and flagellar H antigens are frequently used to identify S. Typhi from S. Paratyphi. Widal test is the most commonly used serological test to measure the bacterial O and H antigens agglutination (37, 38). Agglutinating antibodies against flagella (H) and lipopolysaccharide (LPS) (O) antigens of S. Typhi are measured using WT (39). This technique is unreliable and has low specificity and sensitivity (26). Several rapid diagnostic tests (RDTs) have been demonstrated as a rapid diagnostic assay for the assessment of enteric fever-specific immunodominant antigens (3). Tubex test can be used to identify anti-O2 antibodies in S. Paratyphi and anti-O9 IgM antibodies in S. Typhi (40, 41). Typhidot can be utilized to identify IgG and IgM antibodies against the 50-kDa outer membrane protein of S. Typhi (42, 43). IgM is the appropriate marker for detecting acute infection amongst individuals that do not previously have typhoid fever. The serological tests that are currently available cannot reliably diagnose enteric fever as lots of the antigens are being shared amongst various Salmonella serovars. The serological diagnosis of enteric fever relied on identifying antibodies against Salmonella LPS or flagellum and this brings causes high false-positive results (44).
3.3. Culture-based Diagnosis for Enteric Fever
The culture technique is the reference standard and is used for the characterization of disease-causing organisms for antibiotic resistance genes. Blood culture techniques confirmed Salmonella infection (n = 36), stool culture-confirmed (n =11), PCR confirmed (n=1) and bone marrow culture (n = 2) (Table 1). Several gold standard techniques have been utilized to assess enteric fever diagnosis and blood culture is ultimately used. The major problem in assessing the accuracy of enteric fever diagnosis is the absence of a perfect gold standard. Meyer et al. (45) revealed that no particular test protocol of TF has adequately good performance and recommended the use of the most recent techniques as useful for the composite reference standards.
Enteric fever decisive diagnosis involves the isolation of Salmonella species in blood and/or bone marrow (46). For the period of the first two weeks of TF infection, where the bacteria burden is highest, a 5 to 10 ml blood sample is necessary for school-age children and the elderly (47, 48). A small volume of blood (2 to 4 mL) is utilized to diagnose preschool children (46) and could be associated with underdiagnosis amongst younger people (49). Culture-based diagnosis is often affected because of the intake of antibiotic treatment before diagnosis (50, 51). This drawback is overwhelmed by the use of bone marrow techniques as bacteria in the bone marrow are not killed by the treatment of antibiotics (50, 52). Urine, stool, rose spot and duodenal bile are biological samples that could also be used for the cultural isolation of Salmonella species.
3.4. Nucleic Acid Detection-based Diagnosis for Enteric Fever
Polymerase chain reaction (PCR) is a nucleic acid technique utilized to detect Salmonella serovar-specific DNA. This technique requires extracting DNA from the blood of the patient and amplification of the DNA sequences. PCR technique is a non-culture-based technique used to detect S. Typhi and S. Paratyphi A flagellin genes (53, 54). Laboratory methods to lyse the erythrocytes have revealed interesting outcomes (55) and the extraction of DNA from samples could generate increased yield, thus improving sensitivity and specificity (56). Loop-mediated isothermal amplification (LAMP) is a technique that targets specific S. Typhi genes at a constant temperature (57, 58). The most frequently used target genes for TF diagnosis are cytotoxin (clyA), flagellin (fliC), heat-shock protein (groEL), 16s rRNA, Vi polysaccharide (viaB), as well as other genes that are conserved. Because of the absence of reference standard techniques, assay accuracy usually relied on the findings of blood culture. Several investigations revealed a sensitivity of 40–100% and specificity of approximately 100% only if the study is carryout under optimum conditions (59-67).
Transcriptomics require the measurement of gene expression in a given cellular compartment at a specific time. The transcript mRNA is measured and quantified by the quantity of mRNA transcribed from genomic DNA using microarrays and RNAseq high-throughput molecular technology. A small quantity of whole blood samples can be used to produce gene expression profiles (68). Therefore, transcriptomic is being used for human transcriptional response to several illnesses (69-74) as well as other different immune perturbations (68, 74-76). The human challenge model is the source of various gene expression datasets, allowing the interrogation of the human transcriptional responses to S. Paratyphi A and S. Typhi (33, 73, 77). This technique uses the response of the host as a possible biomarker to detect typhoid fever individuals (78). Host genes can also be detected by the use of microarray analysis. Five host genes (PSME2, STAT1, WARS, ALDH1A1, and SLAMF8) were investigated and were able to detect TF with 88% specificity and 97% sensitivity (77). A new technique such as miniature NMR has been proposed that uses magneto-DNA probes in identifying bacterial mRNA (32).
3.5. Protein Biomarkers
Modified proteomics and immune screening are high-throughput techniques which have been utilized to detect immunodominant antigen signatures associated with TF (30, 44, 79, 80). In Nigeria, investigations on children with acute enteric fever based on proteome microarray tested IgM, IgG ELISAs, and IgA using HlyE proteins as well as S. Typhi LPS (81, 82). This study recognized putative serodiagnostic biomarkers such as invasion (SipC), bacterial cell surface (OmpA) as well as proteins (26). Other studies of S. Typhi proteome arrays have shown HlyE as a suitable serodiagnostic biomarker based on IgG and IgA responses (26, 30, 44, 81) OmpA is also a valuable biomarker from proteomic screening (30). Salmonella Typhi proteome array screening has detected N-acetyl muramoyl-L-alanine amidase (t2002, STY0927) as a new putative biomarker which is used in the catabolism of peptidoglycans.
Liquid chromatography–mass spectrometry (LC–MS) has been used to detect several hundred Salmonella antigens. Western blotting is a conventional method for the differential diagnostic potential of acute TF (83). ELISA and immunodot blot techniques used in the evaluation of IgA titers against membrane components of S. Typhi and S. Paratyphi showed 78–97% specificity and 100% sensitivity (84-86). TPTest is a valuable tool used to differentiate acute infection from convalescence in disease diagnosis (86).
3.6. Metabolite Biomarkers
Metabolomics is a technique for scientific research and was developed to identify as well as quantify small quantities of chemicals in complex biological samples (87). Progress has been made to validate the diagnosis of TF by using diagnostic metabolites in blood plasma (88). This technique is useful for several infectious diseases, detecting signatures of inflammatory disease, urinary tract infections and viral infections (89-91). Furthermore, it could forecast disease outcomes, development, and even commencement, as was recorded in tuberculosis (92). This technique was used to produce metabolites by 2-dimensional gas chromatography with time-of-flight mass spectrometry from 50 typhoid fever patients (25 having S. Typhi and 25 having S. Paratyphi A) against 25 febrile controls (88). It has been identified and validated that significant and reproducible metabolomics signatures could separate typhoid and other febrile illness with asymptomatic controls in a Nepali patient cohort (88, 93). This diagnosis compares the metabolites profiles of healthy and infected persons with typhoid and paratyphoid. The threshold is determined to single out those with acute typhoid fever (94). Following acute infection with S. Typhi, a specific interferon signature that alters tryptophan catabolic pathways is generated (33).
3.7. Genomics
This technique has allowed for S. Typhi genome sequencing and assisted in the recognition of specific gene targets. DNA markers that are S. Typhi specific have been identified with the application of nucleic acid sequence alignment tools (BLASTn) and genome database. The primer designed for amplifying specific gene sequences was authenticated using S. Typhi, non-Typhi Salmonella and non-Salmonella clinical isolates (21).
Table 1. Diversity of Typhoid fever diagnostic protocols and accuracy values
| Diagnostic tests | Study design | Sample size (13,036) | Gold Standard | Country | Prev1 (%) | Sen2 (%) | Spec3 (%) | PPV4 (%) | NPV5 (%) | Ref |
| Widal | Cross-sectional | 372 | Stool culture | Ethiopia | 56.2 | 80 | 44.5 | 3.8 | 98.8 | (95) |
| Widal | Cross-sectional | 95 | Stool culture | Ethiopia | 68.4 | 84.2 | 35.5 | 24.6 | 90 | (96) |
| Widal | Randomized design | 125 | Stool Culture | Nigeria | 17.6 | 78.3 | 93.6 | 68.2 | 98.1 | (97) |
| Widal | Cross sectional | 158 | Stool Culture | Tanzania | 81 | 81.5 | 18.3 | 10.1 | 89.7 | (98) |
| Widal | Prospective study | 810 | Blood and stool culture | Nigeria | NR | 49.1 | 90.7 | 46.2 | 91.6 | (99) |
| Widal | Cross-sectional | 91 | Stool culture | Nigeria | 62.5 | 71.4 | 66.7 | 83.3 | 50 | (100) |
| Widal | NR | 71 | PCR | India | NR | 50 | 50 | 92.8 | 39.5 | (63) |
| Widal | Comparative study | 112 | Stool culture | Cameroon | 57.1 | 40.9 | 32.4 | 6.44 | 28.1 | (101) |
| Widal | Cross-sectional | 158 | Blood and stool culture | NR | 81 | 81.5 | 18.3 | 10.1 | 89.7 | (98) |
| Widal | Retrospective study | 100 | Blood Culture | India | NR | 71.4 | 47.3 | 9.25 | 95.7 | (102) |
| Widal | Prospective study | 270 | Blood culture | Ethiopia | 32.6 | 71.4 | 68.4 | 5.7 | 98.9 | (102) |
| Widal | Prospective study | 163 | Blood culture | India | 54 | 65.4 | 89.8 | NR | NR | (103) |
| Widal | Cross-sectional | 271 | Blood culture | Nigeria | 45.76 | 35 | 51 | 17 | 73 | (104) |
| Widal | Cross-sectional | 100 | Blood culture | 100 | NR | 58 | 85 | NR | NR | (105) |
| Widal | Prospective study | 40 | immunochromatographic test | India | 67.6 | 90 | 81.25 | NR | NR | (106) |
| Widal | Cross-Sectional | 558 | Stool culture | Cameroon | 57.17 | 94.44 | 48.35 | 21.32 | 98.33 | (107) |
| Widal | Comparative study | 71 | Blood culture | Bangladesh | 59.15 | 100 | 89.9 | NR | NR | (108) |
| TUBEX | Retrospective study | 179 | Blood culture | South Pacific ocean | NR | 77.6 | 60.5 | 32.2 | 91.5 | (109) |
| Widal | Cross-sectional study | 158 | Stool culture | NR | 81 | 81.5 | 18.3 | 10.1 | 89.7 | (98) |
| Widal | Randomized | 125 | Stool culture | Nigeria | 17.6 | 78.3 | 93.6 | 68.2 | 98.1 | (97) |
| Typhidot | Comparative study | 140 | Blood culture | Egypt | 30 | 93.3 | 90.6 | 82.3 | 96.6 | (110) |
| Widal | Comparative study | 140 | Blood culture | Egypt | 28 | 86.7 | 89.5 | 79.5 | 93.4 | (110) |
| TUBEX | Comparative study | 139 | Blood culture | Tanzanian | NR | 79 | 89 | NR | NR | (111) |
| TUBEX | Retrospective study | 970 | Blood culture | Pakistan | 1.86 | 41.9 | 96 | 31.6 | 97.3 | (112) |
| Typhidot | Retrospective study | 42 | Blood culture | NR | NR | 92.7 | NR | 97.4 | NR | (113) |
| Typhidot | Cross-sectional | 211 | Blood culture | NR | 95.9 | 95.9 | 26.5 | 30.3 | 96 | (114) |
| Typhidot | Prospective study | 500 | NR | Cambodia | 63.6 | 63.6 | 82.9 | 26.4 | 95.9 | (96) |
| Typhidot | Retrospective study | 145 | Blood culture | NR | 32.4 | 26.7 | 61.5 | 7.4 | 87.9 | (115) |
| Multiplex PCR | Prospective study | 680 | Blood culture | Bangladesh | 20 | 95 | 92.9 | NR | NR | (63) |
| Enterocheck | Prospective study | 145 | Blood culture | NR | NR | 85.5 | 88.6 | 51.1 | 97.7 | (13) |
| Widal | Prospective study | 80 | Blood culture | India | 62.5 | 71 | 62 | 91 | 31 | (116) |
| clyA qPCR | NR | NR | Blood culture | Pakistan | NR | 28.57 | ≥90 | NR | NR | (117) |
| RT PCR | NR | NR | Blood & bone marrow | Nepal | NR | 53.9 | 100 | NR | NR | (67) |
| PCR | NR | NR | Blood culture | India | NR | 100 | 76.9 | NR | NR | (66) |
| PCR | NR | NR | Blood culture | Malaysia | NR | 100 | 100 | NR | NR | (118) |
| PCR | Comparative study | 76 | Blood culture | NR | NR | 100 | 86.5 | NR | NR | (21) |
| Widal | 88.6 | 62.5 | ||||||||
| Widal | Comparative study | 105 | Blood culture | India | 45.7 | 34.1 | 42.8 | NR | NR | (119) |
| Typhidot | 74.3 | 92.6 | 37.5 | |||||||
| Typhidot | NR | 124 | Blood culture | NR | 97.36 | 96 | 89.5 | 95 | NR | (120) |
| Widal | 73.68 | 72 | 87 | 87 | ||||||
| Widal | Comparative study | 140 | Blood culture | Egypt | 35 | 86.7 | 89.5 | 79.5 | 93.4 | (121) |
| Typhidot | 36.5 | 93.3 | 90.6 | 82.3 | 96.6 | |||||
| Widal | Comparative study | 100 | NR | India | 48.1 | NR | NR | 94 | NR | (110) |
| Widal | 26 | 52 | ||||||||
| Widal | Comparative study | - | Blood culture | New Delhi | 57 | 57 | 83 | NR | NR | (122) |
| Typhidot | 79 | 79 | 87.5 | |||||||
| ONSITE Typhoid Combo | NR | 136 | NR | Zimbabwe | NR | 100 | 94.4 | 63.2 | 100 | (123) |
| TUBEX | 100 | 94.1 | 63.2 | 100 | ||||||
| Typhidot | NR | 97 | Blood and bone marrow | Pakistan | 70 | 70 | 77 | 89 | NR | (124) |
| Widal | 54 | 55 | 81 | 89 | ||||||
| Widal | Prospective study | 100 | Blood culture | India | NR | 68 | 86 | 94 | 57 | (23) |
| Typhidot | 85 | 100 | 100 | 75 | ||||||
| Typhidot | Comparative study | 2699 | Blood culture | India | NR | 97.3 | 88.1 | 97.4 | 87.8 | (43) |
| Enteroscreen | 98.2 | 92 | 96.2 | 82.3 | ||||||
| Widal | Comparative study | 1371 | Blood culture | Nepal | NR | 84.1 | 52.7 | 25.3 | 94.5 | (125) |
| ELISA | 95.5 | 94.7 | 77.7 | 99.1 | ||||||
| Typhidot M | Prospective study | 145 | Blood culture | India | 90 | 100 | 100 | 92.1 | (126) | |
| Diazo test | NR | 86.7 | 85.7 | 83.9 | 88.2 | |||||
| Widal | 40 | 91.4 | 80 | NR | ||||||
| Panbio ELISA | Prospective study | 144 | NR | NR | 84 | 78 | 80 | 68.4 | 87.4 | (127) |
| Widal | 98 | 76.6 | 69 | 98.6 | ||||||
| Typhidot | 98 | 76.6 | 98.6 | 69 | ||||||
| TUBEX | NR | 500 | Blood culture | New Guinea | 15 | 51.1 | 88.3 | 0.31 | 0.95 | (128) |
| Typhidot | 23 | 70 | 80.1 | 0.26 | 0.96 | |||||
| TyphiDot Rapid (TR-02) | 22 | 89.4 | 85 | 0.38 | 0.99 | |||||
| Widal | 8 | 51.1 | 95.8 | 0.56 | 0.95 | |||||
| Multi-test Dipstick | Prospective study | 80 | NR | Vietnam | NR | 89 | 50 | 85 | 60 | (129) |
| Typhidot | 79 | 89 | 96 | 59 | ||||||
| TUBEX | 78 | 94 | 98 | 59 | ||||||
| Widal | 64 | 76 | 88 | 48 |
1. Prev = Prevalence 2. Sen = Sensitivit 3. Spec = Specificity 4. PPV = positive predictive value 5. NPV = Negative predictive value, NR = Not reported
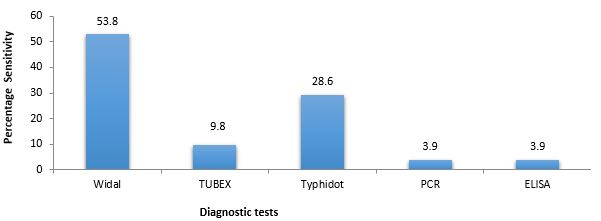
Figure 2. The mean percentage sensitivity of typhoid fever diagnostic techniques
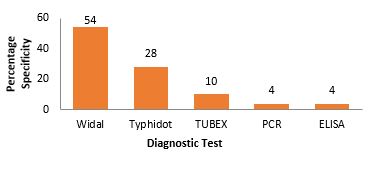
Figure 3. Mean percentage specificity of typhoid fever diagnostic techniques.

Figure 4. Mean percentage positive predictive value of typhoid fever diagnostic technique.

Figure 5. Mean percentage negative predictive value of enteric fever diagnostic techniques.
Table 2. Enteric fever diagnostic protocols
| Diagnostic protocols | Limitations | Advantages | Adjustments* |
| Bone marrow/blood/ bile/stool/culture |
i. Low sensitivity: ~80% bone marrow culture, ~50% blood culture, moderate sensitivity and specificity for bile and stool culture ii. Collection of bone marrow sample is invasive. iii. Waste of time (48 h). iv. Require trained personnel and infrastructure | 100% specificity for blood/bone marrow. ii. Isolated enteric fever could be utilized for successive antibiotic susceptibility tests/molecular characterization | i. Use of larger sample volume ii. Lyse blood cells to release bacteria. |
| Serological tests | i. Cross-reactivity. ii. Moderate sensitivity and specificity | i. Most serological assays are simple, rapid, and cheap ii. Quick turnaround time | i. Use of isolated or cultured bacteria |
| Bacterial nucleic acid detection |
i. Moderate sensitivity and specificity. | i. Nucleic acid assays could also identify non-culturable/dead bacteria | i. Nucleic acids of bacterial can be enhanced by removing human DNA and transient culture |
* Success rates of assay can be enhanced by modifications.
Table 3. Characteristics of included studies that utilized antibody detection
| Technique | Biomarker | Sensitivity (%) | Specificity (%) | Sample | No of Samples | Reference |
| ELISA | Anti-LPS IgA | 89.2 | 100 | Saliva | 37 Positive S. Typhi blood culture, | (130) |
| IC-LFT | Anti-LPS (IgG IgM) and anti-flagellin (IgG IgM) |
68.8 | 71.1 | Serum | 80 Positive S. Typhi blood culture and 256 negative S. Typhi blood culture |
(131) |
| ELISA | Anti-CdtB IgM | 100 | 83.3 | Serum | 100 Positive S. Typhi blood culture and 12 healthy controls | (132) |
| ELISA | Anti-HlyE (IgG IgM and IgA) |
70 | 100 | Serum | 50 Positive S. Typhi blood culture and 6 positive S. Paratyphi A blood culture |
(133) |
| Dot-EIA | Anti-50 kDa (IgG IgA IgM) |
90.9 and 100 (Saliva) | 85.4 and 100 (Serum) | Saliva, serum |
11 Positive S. Typhi blood culture and 43 non-typhoid fever patients | (134) |
| ELISA | Anti-HlyE (IgG IgA IgM) and anti-YncE (IgG IgA IgM) |
83 | 98 | Serum | 115 acute typhoid cases, 95 healthy controls, 117 food handlers |
(135) |
| ELISA | Anti-HlyE IgA, anti-MP IgA and anti-LPS IgA |
90 (HlyE), 90 (LPS), 90 (MP) | 87 (HlyE), 77 (LPS), 48 (MP) | Serum | 105 Positive S. Typhi blood culture, 84 healthy controls | (82) |
ELISA = enzyme-linked immunosorbent assay; HlyE = hemolysin E; LPS = lipopolysaccharides; CdtB = cytolethal distending toxin subunit B; MP = membrane protein; Ig = immunoglobulin; Dot-EIA = dot enzyme immunoassay; YncE = uncharacterized protein
The study reveals that the practice of combining the existing sensitive and specific techniques could surmount the shortcoming of accuracy that is intrinsic in a single test. The application of composite reference standards could enhance better appraisals for assay performance based on combinations of different assays. The study is aimed at assessing typhoid diagnostic accuracy and the urgent need for the best components of enteric fever CRS in other to establish a standardized composite reference as a novel typhoid protocol. Furthermore, the use of CRS will enhance assurance in the assessment of TF prevalence. An urgent need is required for improved TF diagnostic tests for better evaluations of disease burden and to hasten the approval of novel typhoid vaccines (136, 137). In order to achieve this, standardization and approval of one reference standard based on a composite reference are necessary.
4.1. Challenges and Future Outlook
Identifying real typhoid patients with negative blood cultures is a significant constraint in enteric fever diagnosis (127). About 20mL to 30mL of blood is needed to detect blood-related infections and this poses challenges among the elderly and neonatal patients (128). Additionally, lack of funding support, research capacity, and lack of institutional infrastructure are challenges facing TF diagnosis and other infectious diseases, especially in Nigeria. The absence of a perfect test leads to unwise antibiotic use, resulting in complications, morbidity as well as drug resistance.
It is desirable to develop a diagnostic technique that will require a small volume of blood with rapid and accurate detection. Furthermore, the quality of a reliable future evaluation of enteric fever diagnosis can be improved by the use of CRS because of the lack of a perfect diagnostic technique. This will enhance assurance in prevalence estimates and avoid inappropriate intake of antibiotics by patients that do not need them. It has been anticipated that a computational model using Bayesian probability can be used to estimate the accuracy of TF diagnostic assays (137). Future research should employ a prospective cohort design with CRS as a diagnostic tool. From our outlook, metabolite profiles are the possible upcoming solutions for TF diagnosis. An urgent need is required for researchers to find out a model biomarker(s) that can be uttered in initial infection and show drug-resistance profiles as well as differentiates acute infection from subclinical or chronic infections in widespread regions. The use of CRS as an upgraded reference standard for typhoid fever diagnosis will improve the actual worldwide burden of typhoid widespread.
4.2. Limitations and Strengths of the Study
The limitations in this study arise from the variety of diagnostic techniques employed by several researchers, as well as the way the assays were conducted. Due to this, many research articles could not be included in the study and the analysis was based only on published literature. Regardless of these limitations, the strength of this study is the thorough review of published peer review articles assessing the current trend and performance of various diagnostic protocols for the detection of enteric fever.
It is a real possibility to eliminate typhoid fever, but novel diagnostics are necessary and should be factored into a future trajectory for disease control. This study reveals emerging enteric fever diagnostic tests such as protein biomarkers, metabolite biomarkers, nucleic acid biomarkers and genomics. This study found diverse evidence of typhoid diagnostics with a substantial degree of variation in typhoid fever testing. The diversity of enteric fever diagnostic tests lacks flawless reference standards with optimum accuracy, hence the necessity for a synchronized and appropriate standardized composite reference. The principle research outcome of this finding reveals that the diagnostic performance of the Widal test was moderate at a sensitivity of 53.8%. The combination of imperfect tests to determine typhoid fever disease status is a transparent technique to deal with the challenge of imperfect reference standards. However, the study proposes the combinations of peripheral blood culture as well as the Widal test as a composite reference standard which will possibly improve confidence in prevalence estimate.
The authors are pleased to thank the authors of research articles that were obtained in writing this article. Special thanks go to the members of the Department of Information Technology, SIRONigeria Global Limited, Abuja for their assistance in the downloading of resources and articles used in this study.
Not applicable.
Conflicts of Interest
The authors declared no conflicts of interest.
B.E.I. got the concept of the study. S.I.R.O. designed the project and supervised the study. B.E.I. drafted the manuscript. S.I.R.O. and BEI curated and analysed the data obtained as well as the interpretation of the study. S.A.M., I.B.O., O.M.O., I.A.E., and U.J.O. participated in the conduct of data analysis and literature search and sorting. S.I.R.O. and B.E.I. critically reviewed and revised the manuscript for important intellectual content. All authors read through the final version of the manuscript and gave consent for its publication.
This study did not receive any specific grant from funding agencies in the public, commercial, or not-for-profit sectors.
Received: 2022/01/11 | Accepted: 2022/06/9 | ePublished: 2023/01/20
| Rights and permissions | |
 |
This work is licensed under a Creative Commons Attribution-NonCommercial 4.0 International License. |
Copyright Policy
Iranian Journal of Medical Microbiology by Farname is licensed under CC BY-NC 4.0![]()
![]()
![]()
