


![]()
![]()
![]()
BibTeX | RIS | EndNote | Medlars | ProCite | Reference Manager | RefWorks
Send citation to:
URL: http://ijmm.ir/article-1-2319-en.html


 , Arman Soleimany2 , Abbas Shakoori Farahani3 , Jila Yavarian4 , Mohammad Arabzadeh5 , Helya Bolouki Azari2 , Maryam Edalatifard6 , Abolfazl Sobati7 , Ramin Rahimnia8 , Sina Arefi2 , Mahsa Doomanlou9
2- Department of Infectious Diseases, Imam Khomeini Hospital Complex, School of Medicine, Tehran University of Medical Sciences, Tehran, Iran
3- Department of Medical Genetics, School of Medicine, Imam Khomeini Hospital Complex, Tehran University of Medical Sciences, Tehran, Iran ,
4- Department of Virology, School of Public Health, Tehran University of Medical Sciences, Tehran, Iran
5- COVID-19 Laboratory, Imam Khomeini Hospital Complex, Tehran University of Medical Sciences, Tehran, Iran
6- Thoracic Research Center, Imam Khomeini Hospital Complex, Tehran University of Medical Sciences, Tehran, Iran
7- Department of Nursing and Midwifery, Imam Khomeini Hospital Complex, Tehran University of Medical Sciences, Tehran, Iran
8- Department of Medical Nanotechnology, School of Advanced Technologies in Medicine, Tehran University of Medical Sciences, Tehran, Iran
9- Genetics Laboratory, Imam Khomeini Hospital Complex, Tehran University of Medical Sciences, Tehran, Iran
Influenza viruses belong to the Orthomyxoviridae family and usually circulate more frequently from fall to near spring every year (1). Influenza infections are one of the most significant causes of lower and upper respiratory tract infections in humans (2, 3). Seasonal influenza viruses periodically cause respiratory diseases epidemics, which are severe in immunocompromised patients and cause death of many patients worldwide due to respiratory function failure (4). Influenza viruses are also an important cause of missed work in adults and absenteeism from school in children and adolescents (5). They can be easily transmitted from person to person through infectious droplets dispersed in the air by sneezing and coughing (6).
Based on the antigenic differences in the core proteins, there are three types of seasonal influenza viruses: A, B, and C, among which type A is the most common and important human pathogen. Influenza A viruses are classified by subtypes based on the amino acid differences in the surface proteins, with influenza A subtypes H3N2 and H1N1 currently circulating among humans (7-9). Influenza A virus was responsible for the infection in more than 70% of the patients, according to a large report of influenza epidemics from Iran between 2010 and 2015 (10).
The initial diagnosis of influenza is based on the clinical pictures, which can vary from asymptomatic individuals to those with flu-like symptoms and, in severe cases, patients with fulminant pneumonia (11). The symptoms and severity of the disease may vary depending on the virus type and subtype and its periodic antigenic changes, season, region, and the patient’s age, genetic factors, medical conditions, and immunity history (12). Considering these variabilities, studies are needed to evaluate the clinical characteristics and outcomes in the influenza-infected hospitalized patients during the annual epidemics to raise the clinicians’ awareness of the possible year-to-year changes in the clinical symptoms and help in better patient management.
In Iran, similar to many countries in the Northern Hemisphere, influenza epidemics occur in cold seasons, i.e., autumn and winter (10). The influenza A H1N1-2009 pandemic in Iran had a mortality rate of marginally above 2% (13). In a systematic literature review by Soudani et al., (14) on the epidemiology of influenza virus in the Middle East and North Africa, the region with high prevalence of chronic diseases as the risk factor, several studies on the influenza epidemiology were reported in Iran, between 2008 and 2020. Most studies reported the co-circulation of both influenza A and B, and some reported the circulation of type A only. In the studies reporting subtypes, in most cases, both H1N1 and H3N2 were detected, and in some cases, H1N1 or H3N2 was the only dominant circulating subtype (14). However, information regarding the clinical features of influenza A (H1N1 and H3N2) infections in Iranian patients has not been evaluated on an annual basis (15).
This study aimed to describe the clinical pictures of the patients with seasonal influenza A (H1N1 and H3N2) in 2022–2023 influenza outbreak in Tehran, Iran.
Study design and setting
A prospective observational study was conducted on the influenza-confirmed patients hospitalized in Imam Khomeini Hospital Complex, Tehran, Iran, from 1st October 2022 to 31th March 2023.
Study population
All hospitalized patients older than 12 years old with confirmed positive influenza RT-PCR tests from nasopharyngeal swabs or respiratory specimens were included in this study. The patients with the hospital stay of less than 48 hr, incomplete records, and COVID-19 co-infection were excluded from the study.
Influenza type identification
First, nasopharyngeal samples from the patients suspected with influenza infection were collected and transported to the hospital laboratory in viral transport media (VTM). Then, the RNA extraction was conducted using a manual column-based kit (BehGene, Iran). The released RNA was captured and purified using magnetic beads. The extracted samples were stored at -80ºC. The purified viral RNA was converted into complementary DNA (cDNA), using reverse transcriptase and gene-specific primers (HanaGene, Iran). Further amplification and quantification was done by the real-time polymerase chain reaction (RT-PCR) method with specific forward and reverse primers and probes targeting conserved regions of the M or HA genes within the viral genome using the HanaGene kit (Iran) and the CFX96 detection system (Bio-Rad, USA).
HanaGene is a multiplex RT-PCR kit intended for the qualitative detection of influenza A, influenza B, and SARS-CoV-2 RNA genome. It simultaneously detects one target gene for influenza A and B and two target genes for SARS-CoV2. The lowest dilution for influenza A and B viruses was determined based on the test results. The detection limit was 200 copies/mL for influenza A and 500 copies/mL for influenza B.
Influenza subtype identification
The samples positive for influenza virus were sent to the National Influenza Center (NIC), where influenza virus subtyping was carried out using the real-time RT-PCR kit (SuperScript III Platinum, Invitrogen, USA) according to the Centers for Disease Control and Prevention (CDC) protocol (16).
Data collection
Different patients’ data including demographics, comorbidities, medication history, chief complaints, length of hospitalization, outcomes, and recent influenza vaccination were collected from the hospital electronic system. The results of laboratory tests performed on the first day of hospitalization, including inflammatory markers and blood cell counts, were also extracted from the system and analyzed. The chest CT scans of the patients were also examined for the radiological signs by a blinded pulmonologist, and the results were analyzed. The patients were categorized based on the virus type and their characteristics were compared.
Statistical Analysis
The data were analyzed using SPSS software version 28 to report descriptive and inferential statistics. First, the Shapiro-Wilk test was used to check the normality distribution of quantitative variables. To compare the mean variables between the groups, the independent sample t-test was used if the data were normally distributed; otherwise, the non-parametric Mann-Whitney test was applied. The Chi-square test and Fisher's exact test were used to check the relationship between the qualitative variables according to the expected values. Finally, a simple logistic regression model was used to investigate the effect of each independent variable on the binary dependent variable. Variables that were significant at the 0.05 level in bivariate logistic regression were included in the multiple logistic regression model. Statistical indices were reported as mean ± standard deviation (SD) for the normal variables, median (Quartile1, Quartile3) for the non-normal variables, and frequency percentage for the categorical variables. A significant level of 5% was considered.
Of 216 hospitalized patients with influenza who were evaluated, 165 patients were finally included. All patients belonged to the influenza type A, of which 148 (89.7%) were infected with H3N2 and 17 (10.3%) with H1N1. Among the patients 44.8% were female and 55.2% were male. The characteristics of both groups can be seen and compared in Table 1. The median age of the patients was 49 years (35.5, 64.5). The patients were symptomatic for a median of 8 (4, 14) days. The symptomatic duration did not show any significant difference between the groups of H3N2 (8 days) and H1N1 (5 days) (P=0.091). The most common clinical symptoms were dyspnea (60.6%), fever (58.8%), productive cough (37.6%), and chills (37%) (Figure 1). In terms of the clinical symptoms, only weakness was significantly (P=0.044) more common in the H3N2 group. The median body temperature was 37.7°C (36.0, 40.5) at first visit. The median oxygen saturation level of the patients was also significantly (P=0.029) lower in the H3N2 group (91%–81.0, 96.0) than in the H1N1 group (95%–90.0, 97.5).
No significant difference was observed in the demographic characteristics between two groups (P>0.05). The patients with the H3N2 infection had a numerically longer median hospital stay than those infected with H1N1 (9 vs. 4 days, P=0.055). The most common underlying diseases were hypertension (30.9%), ischemic heart diseases (25.5%), and diabetes mellitus (21.8%). Chemotherapy and liver diseases were significantly higher in the H1N1 group (P<0.05).
While 26.1% of the patients did not have any pulmonary involvement, 33.9% had pulmonary involvement in both lungs. Ground glass opacity (GGO) was the most common radiological pattern reported in 69.1% of the patients. Only one patient had received the influenza vaccine in the recent year.
Nineteen patients (11.55%) died in this study. The mortality rate had no significant association with the clinical symptoms, age, and the type of influenza (P˃0.05). However, the results indicated that mortality had a statistically significant relationship with malignancy, chemotherapy, and liver diseases (P<0.05).
Table 1. Characteristics of patients with influenza hospitalized during 2022-2023 cold season’s outbreak
| H3N2 (148) | H1N1(17) | Total (165) | P-Value | ||
| Age (median) | 50.0 (36.0, 65.8) | 43.0 (33.0, 55.5) | 49 (35.5, 64.5) | 0.109 | |
| Sex- n (%) Male Female |
83 (56.10) 65 (43.90) |
8 (47.10) 9 (52.90) |
91 (55.20) 74 (44.80) |
0.608 | |
| Worst day of symptoms (median) | 1.0 (1.0, 2.0) | 2.0 (1.0, 3.0) | 1 (1, 3.0) | 0.066 | |
| Symptomatic days (median) | 8.0 (5.0, 14.0) | 5.0 (4.0, 10) | 8.0 (4.0, 14.0) | 0.091 | |
| Hospitalization days (median) | 9.0 (6.0, 16.0) | 4.0 (3.0, 13.0) | 9.0 (3.0, 16.0) | 0.055 | |
| Underlying condition- n (%) Hypertension Ischemic heart diseases Diabetes mellitus Malignancy Chemotherapy Renal diseases Liver diseases Pregnancy |
47 (31.80) 41 (27.70) 35 (23.60) 24 (16.20) 19 (12.80) 22 (14.90) 7.0 (4.70) 10 (6.80) |
4 (23.50) 1 (5.90) 1 (5.90) 6 (35.30) 6 (35.30) 0 (0.00) 3 (17.60) 0 (0.00) |
51 (30.9) 42 (25.5) 36 (21.8) 30 (18.2) 25 (15.2) 22 (13.3) 10 (6.1) 10 (6.1) |
0.487 0.074 0.124 0.089 0.026* 0.132 0.035* 0.601 |
|
| First visit vital signs (median) Pulse rate (beats/minute) Respiratory rate (breaths/minute) Systolic blood pressure (mmHg) Temperature (°C) Oxygen saturation- n (%) |
98.0 (84.0, 114.0) 18.0 (16.0, 28.0) 121.6 ± 23.6 37.9 (36.0, 38.1) 91.0 (81.0, 96.0) |
92.0 (53.0, 197.0) 19.0 (18.0, 22.0) 118.2 ± 13.7 37.6 (37.0, 40.5) 95.0 (70.0, 97.0) |
97.0 (53.0, 197.0) 18 (16.0, 28.0) 120 (107.7-130.2) 37.7 (36.0, 40.5) 92.0 (70.0, 97.0) |
0.777 0.293 0.563 0.729 0.029* |
|
| ICU Admission- n (%) | 42 (28.4) | 5 (29.4) | 47 (28.5) | 1.00 | |
| Mortality- n (%) | 17 (11.5) | 2 (11.8) | 19 (11.5) | 1.00 |
Table 2. Risk factors for death in hospitalized influenza patients
| Dead (19) | Survived (146) | P-Value | |
| Age (median) | 46.0 (29.0, 62.0) | 50.0 (36.0, 65.0) | 0.668 |
| Sex- n (%) Male Female |
11 (57.90) 8 (42.10) |
80 (54.80) 66 (45.20) |
0.798 |
| Worst day of symptoms (median) |
10.0 (8.0, 26.0) | 1.0 (1.0, 1.5) | <0.001* |
| Symptomatic days (median) | 10.0 (9.0, 24.0) | 7.0 (5.0, 13.0) | 0.014 |
| Hospitalization days (median) | 15.0 (9.0, 26.0) | 8.0 (5.0, 14.0) | 0.018 |
| Symptoms- n (%) Fever Dry cough Productive cough Dyspnea Shivering Fatigue Hoarseness Myalgia Nausea Vomiting Anorexia Diarrhea Abdominal pain |
7 (36.8) 1 (5.3) 5 (26.3) 8 (42.1) 5 (26.3) 6 (31.6) 0 (00.0) 5 (26.3) 3 (15.8) 3 (15.8) 6 (31.6) 0 (00.0) 6 (31.6) |
90 (61.6) 48 (32.9) 57 (39.0) 92 (63.0) 56 (38.4) 23 (15.8) 2 (1.4) 34 (23.3) 36 (24.7) 33 (22.6) 17 (11.6) 7 (4.80) 19 (13.00) |
0.039 0.013 0.281 0.079 0.449 0.108 1.00 0.777 0.568 0.768 0.03 1.00 0.045 |
| First visit vital signs (median) Pulse rate (beats/minute) Respiratory rate (breaths/minute) Systolic blood pressure (mmHg) Temperature (°C) Oxygen saturation (%) |
112.0 (86.0,126.0) 20.0 (18.0, 22.0) 109.5 (86.8,130.0) 38.0 (37.0, 38.2) 92.0 (86.5, 96.5) |
95.0 (84.0,110.0) 18.0 (18.0, 20.0) 120.0 (109.3,134.0) 37.6 (37.0, 38.2) 92.0 (91.0, 96.0) |
0.115 0.580 0.028 0.861 0.265 |
| Underlying condition- n (%) Hypertension Ischemic heart diseases Diabetes mellitus Malignancy Chemotherapy Renal diseases Liver diseases Pregnancy |
2 (10.50) 4 (21.10) 2 (10.50) 8 (42.10) 8 (42.10) 3 (15.80) 4 (21.10) 0 (00.00) |
49 (33.60) 38 (26.00) 34 (23.30) 22 (15.10) 17 (11.60) 19 (13.00) 6 (4.10) 10 (6.80) |
0.253 0.784 0.253 0.007* 0.001* 0.722 0.009* 0.607 |
| ICU Admission days (median) | 3.0 (2.0, 7.0) | 1.0 (0.0, 1.3) | <0.001* |
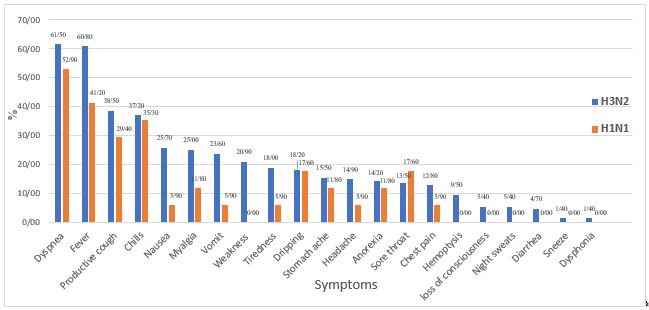
Figure 1. Clinical symptoms of hospitalized patients with influenza A (H3N2) and (H1N1) (Designed by Authors, 2024)
Our results described the clinical and paraclinical aspects of influenza A infection in the hospitalized patients to provide new information to clinicians. All the studied patients were hospitalized and suffered from influenza A infection. This study was not affected by confounding factors, such as other types of influenza or the mild form of the infection. In addition, we compared the clinical and paraclinical data between patients with different subtypes.
Based on the data, influenza A (H3N2) was the dominant type of circulating influenza virus in Tehran, Iran, during the cold season of late 2022 and early 2023. The absence of influenza B reports can be attributed to the global decreased genetic diversity in the lineages of A (H3N2), A (H1N1), and B/Victoria since the COVID-19 pandemic and its related preventive interventions in 2020 (17). Another post-COVID-19 report from Iran indicated that type A influenza virus was notably more common than type B (18). The median age of our patients, who were all hospitalized, was 49 years (35.5, 64.5). The highest and the lowest rates of cumulative incidence of influenza infection in Iran in this season was observed in the age group above 74 years and among teenagers aged 10 to 19 years, respectively (18).
The main clinical features of influenza infection have been largely described, but our knowledge of possible variations in the clinical features of different influenza types is still insufficient (19, 20). Our patients were symptomatic for an average of 8 days. Similarly, in a report of influenza A (H5N1) infection, the patients were symptomatic for an average of 7 days before being admitted to the hospital (19). In the comparison of patients with H3N2 and H1N1 infections, although the symptomatic duration was longer in H3N2 than in H1N1, the difference was not significant.
The most common clinical symptoms in our patients were dyspnea, fever, cough, and chills. In a study on children with H1N1 infection, fever was the predominant symptom, observed in more than 90% of the patients (21). Notably, the symptoms showed no significant difference between the groups with different subtypes in our study. However, a similar study conducted in Japan found that the severity of fever in the H3N2 group was notably higher than that in the H1N1 group (22). Additionally, in our patients, the length of hospitalization was significantly longer in the H3N2 group, indicating the higher severity of clinical symptoms in this group. Despite the wide range of clinical features associated with influenza A virus, fever and respiratory symptoms have been similarly reported as the most common symptoms in most studies (23-25).
The diagnosis of pneumonia is confirmed by observing the radiological opacities in the lung imaging in the patients with clinical evidence of respiratory infection (26). The chest CT scan is a more sensitive and preferable method for diagnosing influenza pneumonia than the chest X-ray (27). Approximately, 74% of our patients exhibited signs of influenza pneumonia on their chest CT scans, which aligns closely with the findings of a similar study conducted between 2016 and 2017 (28).
Consistent with other studies, the most common radiological pattern observed in our patients was GGO in the chest CT scans (27, 28).
Influenza mortality rates often vary between different studies due to differences in the settings, methods, and study populations (29). Seasonal influenza virus infections are estimated to cause approximately 0.5-1% of all deaths annually worldwide (29). Influenza mortality is higher in the elderly and young children and usually occurs after primary viral pneumonia and/or secondary bacterial pneumonia (30, 31). The mortality rate in our patients was nearly 12%, and it was not related to the age or the subtype of influenza virus. Notably, more mortality was observed in the patients with fever, dyspnea, and anorexia, which may align with primary influenza pneumonia or secondary pneumonia. Additionally, the most common risk factors associated with death were malignancy, chemotherapy, and liver failure. Similar studies have also identified various risk factors for death beyond those recorded as influenza deaths (29).
Research findings have shown the cross-subtype protection during successive or simultaneous epidemics caused by H1N1 and H3N2 viruses (32). Influenza vaccines provide more significant protection against H1N1 and type B than H3N2 viruses, prompting recommendations for enhancing the vaccine design for the increased coverage against H3N2 (33). Among our patients, only one person had received the influenza vaccine. The relatively high mortality rate observed in our study may be attributed to the low vaccination rate and the significant number of H3N2 cases.
The important strength of our study lies in its focused examination of the clinical and paraclinical features among the hospitalized patients with the H3N2 virus infection. The limitation of our study is the relatively small sample size, which hinders drawing strong epidemiological conclusions.
The clinical picture of different subtypes of influenza A virus in a hospitalized setting showed dyspnea, fever, and productive cough as the main symptoms. The most common radiological appearance was GGO, consistent with primary viral pneumonitis. The H3N2 group had a lower O2 saturation level than the H1N1 group. The mortality rate in the influenza patients was associated with cancer and liver diseases, but not the virus subtype and the patient's age. Preventive measures, especially influenza vaccination, are strongly recommended to prevent death in the high-risk patients. Increased awareness of evolving changes in the clinical characteristics of the patients with influenza infection each year can enhance the management of these patients.
Informed consent was obtained from all patients and/or their legal guardian(s) for this study.
We would like to thank Mrs. Fariba Zamani, for the language editing of the manuscript and Mr. Saeed Mohammadi for the assistance in data analysis. We also thank the dedicated staff of the laboratory in Imam Khomeini Hospital Complex for all their effort.
Ethical Considerations
This study was approved by the Ethics Committee of Tehran University of Medical Sciences, Tehran, Iran (No: IR.TUMS.MEDICINE.REC.1402.062).
Authors’ Contributions
MS: study design and supervision, AS: data collection and draft writing, AShF: laboratory tests and critical review, JY: laboratory experiments, MA: laboratory tests, HBA: draft writing, ME, AS, RR: data analysis, SA: draft writing.
This research has been supported by Tehran University of Medical Sciences-Thoracic Research Center (Grant Number: 1401-3-101-62902).
Conflicts of Interest
The authors declare that they have no conflict of interest.
Received: 2024/03/15 | Accepted: 2024/07/9 | ePublished: 2024/08/18
| Rights and permissions | |
 |
This work is licensed under a Creative Commons Attribution-NonCommercial 4.0 International License. |
Copyright Policy
Iranian Journal of Medical Microbiology by Farname is licensed under CC BY-NC 4.0![]()
![]()
![]()
