


![]()
![]()
![]()
BibTeX | RIS | EndNote | Medlars | ProCite | Reference Manager | RefWorks
Send citation to:
URL: http://ijmm.ir/article-1-1829-en.html


 , Rehab Mahmoud Abd El-Baky2 , Salah aldin Mohammad Abdalla3 , Ahmed Osama El-Gendy4 , Ahmed Farag Azmy4
2- Department of Microbiology and Immunology, Faculty of Pharmacy, Deraya University, Minia, Egypt
3- Department of Microbiology and Immunology, Faculty of Pharmacy, Suez Canal University, Ismalia, Egypt
4- Department of Microbiology and Immunology, Faculty of Pharmacy, Beni-Suef University, Beni-Suef, Egypt
Skin is considered the most significant barrier against any pathogens (1). If any pathogen transfers through this barrier, infections will occur (1). Wounds may be defined as any injury, damage, or break in the skin surface (1). It may arise accidentally from a surgical incision or induced due to trauma or due to disease as in diabetic foot (2). The induced trauma includes hospital-acquired wound infection estab-lished surgically or due to the use of intravenous medical devices (3). Hospital-acquired wound infections are considered the leading cause of nosocomial infections, prolonging hospital stays and increasing healthcare costs (3).
Most wound infections are classified into two categories including skin and soft tissue infections (4). Erythrasma, cellulitis, folliculitis, erysipelas, and impetigo are the most common skin infections (5). Dermatomycoses are skin infections caused by fungi and yeast (5). Candida albicans, Microsporum, Epidermophyton, Trichophyton, and Malassezia species are the most common fungal organisms (6).
The Pathogens obtained from surgical wound infections vary depending on the surgery performed (7). Escherichia coli, Pseudomonas aeruginosa, Proteus mirabilis, Enterococci Staphylococcus aureus/MRSA Streptococcus pyogenes, and Corynebacterium spp are the most common organisms found in wound infections (8). Staphylococcus aureus is the most dominant source of infection present during clean surgical procedures (9). Bacterial colonization may hinder wound healing if the bacterial load is greater than 105 organisms/g of tissue. Also, the type of bacteria seemed to inhibit wound healing and immune response (10). Culture is performed after a diagnosis of wound infection in order to recognize the pathogenic organisms and to choose the proper antibiotic therapy (8). Systemic antibiotics are preferred more than topical antibiotics in case of infected or colonized wounds (11). Nowadays, the emergence of resistance increases the need to use antimicrobial combinations to overcome this problem (11).
This study aims to identify the most predominant Gram-negative pathogens in wound infections, their resistance profiles to the most used medications in the Egyptian market, and assess drug combination between β-lactams (imipenem)/aminoglycosides (amikacin) in the treatment of severe wound infections.
Bacterial Isolates
One hundered fifty isolates of gram negative bacteria were found in 200 clinical samples collected from different patients suffering from wound infections (wound exudates, abscess exudates, and burn exudates). Patients were attending Minia University Hospital, Egypt from (January 2019- January 2020). Samples were streaked on nutrient agar, blood agar, MacConkey agar, and cetrimide agar. All inoculated cultures were grown at 37°C for 24 hr. Growth was examined both microscopically and biochemically (12).
Antimicrobial Sensitivity Test
The antimicrobial sensitivity test was conducted using Kirby, Bauer (13) disc diffusion method using different antimicrobial agents commonly used in the Egyptian market based on CLSI (2018). Antimicrobial agents used were gentamycin (10µg), Cefepime (30 µg), ceftazidime (30µg), meropenem (10µg), aztreonam (30µg), imipenem (10µg), amikacin (30µg), ofloxacin (10µg), ciprofloxacin (5µg), tobramycin (10µg), piperacillin (100µg), norfloxacin (10µg), levofloxacin (5µg), and piperacillin/tazobactam (10µg). The identified resistant isolates were tested by agar dilution method to investigate minimum inhibitory concentrations (MICs) for amikacin and imipenem according to recommendations and interpretative criteria for the Clinical and Laboratory Standards Institute (14). For better comparison, the MICs for 50% of isolates (MIC50) and 90% of isolates (MIC90) were determined.
Distribution of bla-IMP and aac (6’)-Ib among the Tested Isolates
DNA was isolated from a culture that had been left overnight by the method described by Wilson, 1989 (15). The amplification was conducted with 25µL PCR reaction mixture containing (12.5µL Master mix, (200-400ng) DNA sample, Nuclease free water to 25 µL, 1 µL (20 pmol ), for each forward and reverse primers). PCR cycling conditions are indicated in Table 1. The amplified product was analyzed after electrophoresis on a 2% agarose gel in TBE solution, stained with ethidium bromide and visualized using a UV transilluminator. The product of bla-IMP (488bp) and the product of aac (6’)-Ib (365bp) was assessed by using a 1000-bp DNA ladder.
Table 1. The primers sequences include (16, 17)
| Gene | Primer sequence (5'-3') | Annealing temperature |
| blaIMP | F:CATGGTTTGGTGGTTCTTGT | 59 |
| R:ATAATTTGGCGGACTTTGGC | ||
| Aac(6’)-Ib | F:AGTACTTGCCAAGCGTTTTAGCGC | 51 |
| R:CATGTACACGGCTGGACCAT |
Checkerboard Synergy Test
The synergistic action of the tested antibiotics combinations was determined by the checkerboard synergy test depending on micro-dilution susceptibility testing of imipenem and amikacin each alone and in combination. Each drug was evaluated at dilutions ranging from 0.03 to 64 µg/mL. The inoculum which obtained from colonies grown on MHA overnight. The effect of the studied combinations on microbial growth was measured using fractional inhibitory concentration (FIC).
The formula for calculating FIC index (FICI):
FIC= FIC of drug A+FIC of drug B; FIC of drug A= MIC of drug A in combination with drug B / MIC of drug A only; FIC of drug B= MIC of drug B in combination with drug A / MIC of drug B only. Synergism determined as FIC index of <0.5; Antagonism represented when FIC index of >4 and, FIC index 0.5 < FICI < 4 known as indifference (18).
Time-killing Assay
The in-vitro bactericidal assessment of amikacin and imipenem detected by Time–kill curves. With a starting inoculum of 1.5×10⁸, the test was conducted using concentrations of 0.5xMIC, 1xMIC, 2xMIC, and 4xMIC for each antibiotic alone and in combination. Tubes incubated at 37°C. Aliquots were obtained at 0, 2, 4, 8, 12, and 24 h, serially diluted by plating 10-fold dilutions on Muller-Hinton agar (BD Diagnostics, Franklin Lakes, NJ). The number of colonies was counted after 24h incubation at 37°C (19). Bacteriostatic activities represented as ≥ 2 log10, but < 3 log10 reductions, and bactericidal activities indicates ≥ 3 log10 reductions in CFU/mL at 24 hours relative to the starting inoculum, where synergy seemed as a 2 log10 reduction in CFU/mL when using the drug combination, relative to the most active drug. Each experiment was repeated three times (20).
Seventy Gram-negative isolates were detected in wound infections. E. coli was the most prevalent species (27 isolates, 38.6%), followed by Proteus spp (30%), P. aeruginosa (21.4%), Klebsiella spp. (5.7%) and A. baumannii (4.3%) (Table, 2).
Table 2. Prevalence of gram-negative pathogens among wound infections
| Source of infections | Total number of isolates | E. coli | P. aeruginosa | Proteus spp. | Klebsiella spp. | Acinetobacter baumannii |
| Wounds | 70 | 27 (38.6%) | 15 (21.4%) | 21 (30%) | 4 (5.7%) | 3 (4.3%) |
The antibiotic resistance pattern among the isolated microorganisms (Figure 1) showed that Ampicillin/sulbactam was completely inactive against P. aeruginosa, Proteus spp., Klebsiella spp and A. baumannii. Amoxicillin/clavulanic was completely resistant against E. coli, A. baumannii and Klebsiella spp. Cephalothin was viewed as 100% resistant against P. aeruginosa and A. baumannii. Cefadroxil was completely resistant to Klebsiella spp and A. baumannii. Also, Ciprofloxacin had 100% resistant to A. baumannii. Ceftazidime and Ofloxacin were completely resistant to Klebsiella spp.
Determination of MIC, MIC90 and MIC50 of Amikacin and Imipenem
E. coli was highly resistant to imipenem and amikacin (81.5% and 55.6%, respectively). While A. baumannii showed no resistance to amikacin. On the other hand, P. aeruginosa, proteus spp. and Klebsiella spp. showed low resistance for both imipenem and amikacin as shown in Tables 3 & 4. MIC90 and MIC50 were used for better comparison.

Figure 1. Antibiotics resistance pattern of the tested microorganisms
Table 3. MIC, MIC90 and MIC50 of amikacin against the tested isolates
| Micro-organisms | Total no. of isolates | MIC90 (µg/ml) |
MIC50 (µg/ml) |
No. of Resistant isolates | %* |
| E. coli | 27 | 512 | 32 | 22 | 81.5 |
| P. aeruginosa | 15 | 256 | 64 | 5 | 33.3 |
| Proteus spp. | 21 | 256 | 32 | 7 | 33.3 |
| Klebsiella spp. | 4 | 64 | 64 | 2 | 50 |
| Acinetobacter baumannii | 3 | 32 | 32 | 1 | 33.3 |
* Percent correlated to the number of resistant isolates
Table 4. MIC, MIC90 and MIC50 of imipenem against the tested isolates
| Micro-organisms | Total no. of isolates | MIC90 (µg/ml) |
MIC50 (µg/ml) |
No. of Resistant isolates | %* |
| E. coli | 27 | 512 | 32 | 22 | 81.5 |
| P. aeruginosa | 15 | 256 | 64 | 5 | 33.3 |
| Proteus spp. | 21 | 256 | 32 | 7 | 33.3 |
| Klebsiella spp. | 4 | 64 | 64 | 2 | 50 |
| Acinetobacter baumannii | 3 | 32 | 32 | 1 | 33.3 |
* Percent was correlated to the number of resistant isolates
Distribution of blaIMP and aac(6’)-Ib Genotype Among Isolates
bla-IMP was found in Klebsiella spp. (100%), followed by E. coli (85.2%), A. baumannii (66.7%), Proteus spp. (38.1%) and P. aeruginosa (33.35%). aac(6’)-Ib was highly distributed among E. coli, P. aeruginosa and Proteus spp. (70.4%, 46.7% and 4.8%, respectively) (Table 5 & Figures 2 and 3).
Table 5. Distribution of BlaIMP and AAC (6’)-Ib genotype among the tested isolates
| Name of organism | No. of the isolates in each infection | blaIMP (%)* | AAC (6’)-Ib (%) * |
| E. coli | 27 | 23 (85.2%) | 19 (70.4%) |
| P. aeruginosa | 15 | 5 (33.35%) | 7 (46.7%) |
| Proteus spp. | 21 | 8 (38.1%) | 1 (4.8%) |
| Klebsiella spp. | 4 | 4 (100%) | - |
| Acinetobacter baumannii | 3 | 2 (66.7%) | - |
*Percent was correlated to the no. of each isolate
|
|
|
|
Figure 2. Agarose gel showing PCR-amplified products of AAC (6´)-Ib (365bp). Lane M: 100 bp DNA ladder; lane 1: AAC (6´)-Ib; lane 2: AAC (6´)-Ib; lane 3: AAC (6´)-Ib,; lane 4: AAC (6´)-Ib and lane 5:No band |
Figure 3. Agarose gel showing PCR-amplified products of blaIMP (488bp). Lane M: 100 bp DNA ladder; lane 1:No band :blaIMP; lane 2: blaIMP; lane 3: blaIMP; lane 4: blaIMP; lane 5: blaIMP; lane 6: blaIMP and lane 7: blaIMP |


The combined activity between amikacin and imipenem versus the tested isolates by checkerboard technique
Amikacin and imipenem were assessed in combination because they had good activity against the tested isolates. Also, we expect that this combination may have synergistic activity against MDR isolates due to the difference in mechanisms of action between both antibiotics. Our results showed that the antibacterial combination against resistant strains lowered the MICs of each drug and the efficacy of the tested antibiotics increased. FIC index of both drugs varied from 0.01 to 0.5 indicating synergistic activity for the combination. The effect of amikacin and imipenem combination against resistant strains found to lower MICs for both amikacin and imipenem from 1024µg/ml to 32µg/ml (FICindex 0.06) Table 6.
Table 6. The combined activity between imipenem and amikacin versus the tested isolates:
| Name of bacteria | MIC (µg/ml) | FIC index | Outcome | |||
| Amikacin alone | Imipenem alone | Combination amikacin + imipenem | ||||
| E. coli (No.1) | 1024 | 1024 | 32 | 32 | 0.06 | Synergistic |
| E. coli (No.2) | 1024 | 512 | 32 | 32 | 0.09 | Synergistic |
| E. coli (No.3) | 512 | 512 | 16 | 4 | 0.03 | Synergistic |
| E. coli (No.4) | 512 | 128 | 32 | 8 | 0.125 | Synergistic |
| E. coli (No.5) | 256 | 128 | 32 | 8 | 0.187 | Synergistic |
| E. coli (No.6) | 256 | 64 | 32 | 4 | 0.187 | Synergistic |
| E. coli (No.7) | 128 | 64 | 1 | 0.5 | 0.016 | Synergistic |
| E. coli (No.8) | 128 | 64 | 8 | 4 | 0.125 | Synergistic |
| E. coli (No.9) | 64 | 32 | 1 | 1 | 0.047 | Synergistic |
| E. coli (No.10) | 64 | 32 | 1 | 0.5 | 0.03 | Synergistic |
| E. coli (No.11) | 32 | 32 | 1 | 0.5 | 0.05 | Synergistic |
| E. coli (No.12) | 32 | 16 | 0.5 | 2 | 0.14 | Synergistic |
| E. coli (No.13) | 16 | 8 | 0.5 | 2 | 0.3 | Synergistic |
| E. coli (No.14) | 16 | 4 | 0.5 | 0.25 | 0.09 | Synergistic |
| E. coli (No.15) | 16 | 4 | 1 | 0.5 | 0.19 | Synergistic |
| Ps (No.1) | 1024 | 1024 | 32 | 32 | 0.06 | Synergistic |
| Ps (No.2) | 512 | 512 | 32 | 8 | 0.078 | Synergistic |
| Ps (No.3) | 256 | 256 | 4 | 1 | 0.019 | Synergistic |
| Ps (No.4) | 128 | 128 | 32 | 8 | 0.3 | Synergistic |
| Ps (No.5) | 64 | 64 | 0.5 | 1 | 0.023 | Synergistic |
| Proteus (No.1) | 64 | 512 | 0.5 | 1 | 0.001 | Synergistic |
| Proteus (No.2) | 64 | 16 | 0.5 | 1 | 0.07 | Synergistic |
| Proteus (No.3) | 64 | 8 | 0.25 | 0.5 | 0.066 | Synergistic |
| Kl. (No.1) | 64 | 128 | 2 | 1 | 0.04 | Synergistic |
| Kl. (No.2) | 64 | 64 | 0.5 | 1 | 0.023 | Synergistic |
Time–kill studies
Regarding E. coli (No. 1) resistant to both imipenem and amikacin: The initial bacterial count was 8.2 log10 CFU/ml. At 0.5xMIC there was no significant decrease in bacterial count except after 24hrs by the combination group to 7.46 log10 CFU/ml.
At 1xMIC the bacterial count decreased significantly for each drug alone and showed a significant decrease in colony count (bactericidal) by the tested combination to 3.5 log10 CFU/mL after 24h, indicating synergistic activity. At 2xMIC, a bacteriostatic effect was shown by 2.26 log10 CFU/mL reductions at 12h, indicating bacteriostatic activity. At 4xMIC no colony count found at 12h and 8h for each drug alone and in combination, respectively (Figure, 4).
For Pseudomonas aeruginosa (No. 1) resistant to both imipenem and amikacin.
The initial in-vitro bacterial count was 8.2 log10 CFU/mL, at 0.5xMIC bacterial count decreased to 7.48 log10 CFU/mL after 24h in case of imipenem and amikacin combination. At 1xMIC combination showed 3.2 log10 CFU/mL reductions which indicated bactericidal and synergistic compared with both drugs after 24h. At 2xMIC combination regimen showed bacteriostatic after 12h with 2.49 log10 CFU/mL reductions, bactericidal after 24h with 3.6 log10 CFU/mL reductions, where ≥ 2 log10 CFU/mL reductions after 24h had to be synergistic. At 4xMIC no colony count found after 24h and 12h in the presence of each drug alone and in combination (Figure, 5).
Regarding Proteus (No.1) resistant to both drugs
At 0.5xMIC, combination showed decrease in colony count to 8.03 log10 CFU/mL after 24h, 1xMIC decreased in case of combination to 5 log10 CFU/mL with 3 log10 CFU/mL reductions shown to be bactericidal and synergistic between both drugs. At 2xMIC, bacteriostatic activity was shown after 8h with 2.4 log10 CFU/mL reductions and bactericidal activity after 12h with 3.57 log10 CFU/mL reductions. At 4xMIC, combination showed bacteriostatic activity at 2h with 2.5 log10 CFU/mL reductions and showed bactericidal activity after 4h with 3.7 log10 CFU/mL reductions (Figure, 6).
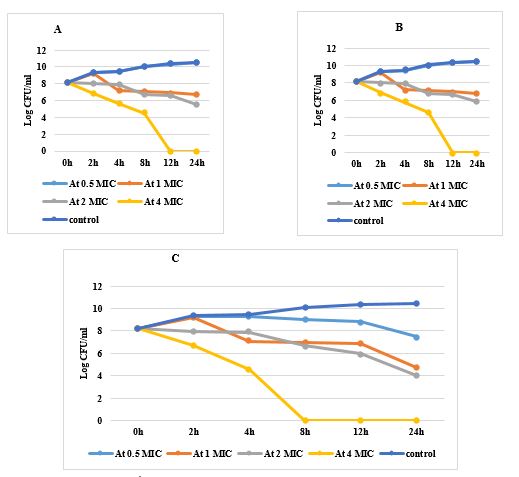
Figure 4. Time killing curve for E. coli A: Treated with amikacin in different concentrations, B: Treated with imipenem in different concentrations, C: Treated with a combination in different concentrations

Figure 5. Time killing curve for P. aeruginosa J: Treated with amikacin in different concentration, K: Treated with imipenem in different concentration, L: Treated with combination in different concentration

Figure 6. Time killing curve for Proteus spp. S: Treated with amikacin in different concentrations, T: Treated with imipenem in different concentrations, U: Treated with a combination of different concentration
The Case of Klebsiella (No.1) resistant to both drugs
At 0.5xMIC, the combination showed a decrease in the bacterial count to 8 log10 CFU/mL. At 1xMIC, the combination showed 3.35 log10 CFU/mL reductions indicating bactericidal and synergistic after 24h. At 2xMIC, the Combination decreased bacterial count after 4h with 2.27 log10 CFU/mL reductions showing bacteriostatic activity while bactericidal was observed after 8h with 3.6 log10 CFU/mL reductions. At 4xMIC combination showed bacteriostatic effect after 2h with 2.49 log10 CFU/mL reductions and showed bactericidal activity after 4h with 3.68 log10 CFU/mL reductions (Figure, 7).

Figure 7. Time killing curve for Klebsiella spp. V: Treated with amikacin in different concentration, W: Treated with imipenem in different concentration, X: Treated with combination in different concentration
Gram-negative bacterial wound infections play an important role in chronicity and slowing wound healing. These infections should be limited and managed by healthcare practitioners by suggesting suitable antibiotic treatments (8).
In this study, 70 Gram-negative microbes were obtained from wounds showing signs of infections. The most predominant strains were E. coli, Proteus spp., P. aeruginosa, Klebsiella spp. and A. baumannii in agreement with Bhatt, Tandel (21) who stated that E. coli, Proteus spp., P. aeruginosa, Klebsiella spp. and A. baumannii were the most prevalent microbes isolated from wound swabs. Bessa, Fazii (8) and Gjødsbøl, Christensen (22) stated that P. aeruginosa, Proteus mirabilis and E. coli were the most common Gram-negative isolates isolated from wound infections.
Exposure to antimicrobial drugs for long periods is the most common cause widespread of resistance among Gram-negative bacteria (23). In the present study, Gram-negative pathogen showed MDR to most of the antibiotics, to overcome this resistance, combination therapy has been used (24). Previously, synergistic combinations of β-lactams and aminoglycosides were reported to overcome resistance caused by MDR Gram-negative bacteria by Lim, Lee (25). The reason for synergism between both drugs is that both drugs act by a different inhibitory mechanism. Beta-lactam antibiotics such as imipenem, attach to penicillin-binding proteins (PBPS) and cause morphological changes in cells (26) whereas aminoglycosides such as amikacin, inhibit protein synthesis (27). Other antibiotics' periplasmic target site penetration is aided by the permeabilizing impact. As a result, carbapenems in conjunction with an aminoglycoside are effective (28). In our study Gram-negative isolates showed complete resistance to Ampicillin/sulbactam, Amoxicillin/ clavulanic, Cephalothin, Cefadroxil, Ciprofloxacin, Ceftazidime and Ofloxacin. A study done by Vena, Giacobbe (29), it was found that Gram-negative pathogens were mostly resistant to cefepime, ceftazidime, ciprofloxacin, piperacillin/tazobactam, and colistin.
One of the most predominant genes of resistance among Gram-negative bacteria are bla-IMP and AAC (6’)-Ib (30). So, we must study the prevalence of these genes in isolated pathogens. Our findings showed that all Klebsiella spp. harbored bla-IMP, followed by E. coli, A. baumannii, Proteus spp. and P. aeruginosa. aac(6’)-Ib were most common among E. coli, P. aeruginosa and Proteus spp. Elbadawi, Elhag (31) reported that 7 isolates out of 21 Gram negative bacteria harbored bla-IMP and Costello, Deshpande (32) stated that aac(6')-lb was the predominant aminoglycoside modifying enzyme. The present study revealed that in-vitro activity of imipenem and amikacin combination showed synergistic action against most resistant Gram-negative pathogens. The combination of both drugs reported a significant decrease in bacterial count shown by the time-kill curve. Such a combination could be a promising therapy in treating lethal Gram-negative bacterial infections as it reduces the risk of monotherapy resistance and improves clinical treatment. The present study opposite to the study done by Mathe, Szabo (18) found that imipenem and amikacin alone had activities much better than their combination in the treatment of Klebsiella. In another study done by Rodríguez-Hernández, Pachón (19), it was found that imipenem as monotherapy was much better than amikacin alone or IMP/AMK combination in the treatment of A. baumannii.
Amikacin and imipenem combination showed the best solution therapy against serious Gram-negative bacterial wound infections and this combination may combat life threatening or severe wound infections.
This research did not receive any specific grant from funding agencies in the public, commercial, or not-for-profit sectors.
The research was approved by the Research and Ethics Committee of the Review Board of Faculty of Pharmacy (Number:8/2021)
Formal analysis: S.M.F. and A.O.E.-G.; investigation: A.F.A.; R.M.A.E-B .methodology, S.M.F.; project administration: A.O.E.-G. and A.F.A .; supervision: R.M.A.E.-B., A.O.E.-G. and S.A.; validation: S.M.F. and S.A.; visualization: A.F.A.; S.M.F Software: S.M.F.; writing original draft: S.M.F. and A.F.A.; writing review and editing: R.M.A.E-B., A.F.A.
None.
Conflicts of Interest
The authors declared no conflict of interest.
Received: 2022/08/22 | Accepted: 2023/01/28 | ePublished: 2023/03/30
| Rights and permissions | |
 |
This work is licensed under a Creative Commons Attribution-NonCommercial 4.0 International License. |
Copyright Policy
Iranian Journal of Medical Microbiology by Farname is licensed under CC BY-NC 4.0![]()
![]()
![]()
