


![]()
![]()
![]()
BibTeX | RIS | EndNote | Medlars | ProCite | Reference Manager | RefWorks
Send citation to:
URL: http://ijmm.ir/article-1-1822-en.html


 , Ahmad Tavakoli2 , Seyed Jalal Kiani1 , Saied Ghorbani1 , Davod Javanmard3 , Milad Sabaei4 , Maryam Fatemipour1 , Seyed Hamidreza Monavari5
2- Research Center of Pediatric Infectious Diseases, Institute of Immunology and Infectious Diseases, Iran University of Medical Sciences, Tehran, Iran
3- Infectious Diseases Research Center, Birjand University of Medical Sciences, Birjand, Iran
4- Antimicrobial Resistance Research Center, Institute of Immunology and Infectious Diseases, Iran University of Medical Sciences, Tehran, Iran
5- Department of Virology, School of Medicine, Iran University of Medical Sciences, Tehran, Iran ,
The role of infectious agents in causing human cancers is undeniable. Despite ye 2019-2010 ars of human genetics studies and research into environmental carcinogens, only a small proportion of significant human malignancies have been linked to congenital genetic mutations and environmental carcinogens. In recent decades, an increasing number of human malignancies have been connected to infectious agents. Moreover, vaccination and other preventive interventions have tremendously reduced the death toll of cancers such as liver, cervical, and gastric cancer, which are associated with infectious agents (1). Viruses are believed to have an important role in developing various types of cancer, and numerous studies have been conducted to investigate the association between viruses and different human malignancies (2-9).
Chronic inflammation plays a vital role in transitioning from pre-neoplastic to an invasive malignancy, and inflammation is considered the seventh hallmark of neoplasia (10, 11). Periods of chronic inflammation may be necessary for the neoplastic process to cause malignancy, and promoters may facilitate it. Cancer promoters may not have a specific oncogenic effect on normal cells but can lead pre-neoplastic cells to malignancy. Infectious agents may play a promotional role in neoplastic transformation; such as the role of the hepatitis C virus in causing liver cancer (12); or the role of Epstein-Barr virus (EBV) in causing nasopharyngeal carcinoma (13).
The role of HCMV in human cancer has not been proven (14). However, there is growing evidence of HCMV detection in small amounts in several human malignancies, suggesting that chronic HCMV infections may play a role in inducing the same type of inflammation as other cancer-related pathogens (15). The role of HCMV in human cancers has been previously studied, including breast (16), glioma (17), and colon (18) cancers.
Prostate cancer is the most common non-skin cancer in men worldwide and is the leading cause of cancer mortality in American men (19). Genetic and environmental factors are believed to contribute to the high incidence of prostate cancer; however, recent epidemiological studies have shown a significant association between the incidence of prostate cancer and increased exposure to sexually transmitted diseases (STDs). This suggests that one or more STD-related factors may increase the risk of prostate cancer (20).
Given that the role of certain infectious agents in the development of prostate cancer has not yet been determined, and bearing in mind the possible role of HCMV infection in the development of various cancers in humans, this study was performed to evaluate the frequency of HCMV infection in prostate cancer patients referred to hospitals in Tehran in 2020.
Two groups of 31 prostate cancer patients were enrolled in this case-control study. Study data were collected from the medical records of prostate cancer patients referred to Rasoul-e-Akram Hospital in Tehran, Iran, between May 2019 and February 2020. Molecular tests were run on a total of 62 biopsy specimens in paraffin blocks. Of these, 31 were obtained from patients with varying degrees of prostate cancer (case group), and 31 from patients with normal prostate malignancies (control group).
Tumor Grade and the Prostate-Specific Antigen (PSA) Assessment
PSA was assessed in both the case and the control groups. The prostate malignancy grades were determined in the case group based on the Gleason score (21-23). Also, the tumor stages were assessed based on the tumor–node–metastasis (TNM) method (24).
DNA Extraction
The specimens were collected as paraffin-embedded tissues from patients with prostate cancer and kept at -20˚C until further analysis. Tissue nucleic acid was then extracted using a tissue genome extraction kit (Tissue genomic DNA extraction kit, Favorgene, Taiwan) as per the manufacturer's instructions. The extracted DNA from all samples was examined by spectrophotometry to measure the 260/280 nm absorption ratio, and samples with a ratio between 1.8- 2 were selected for further testing. A PCR test was conducted on all DNA samples to detect an internal control housekeeping gene (beta-globin) to verify the optimal PCR conditions.
Amplification of ß-globin Gene
The PCR reaction mix contained 1 μL of the extracted DNA, 12.5 μL of 2X PCR Mastermix (Red, Ampliqon, Denmark), and 1 μL of each primer (forward and reverse) with a concentration of 10 picomoles. Sterile deionized water was then added to the mix to reach a final volume of 25 μL. The PCR thermal cycles consisted of an initial denaturation step for 10 min at 95˚C, followed by 35 cycles of 1 min at 94˚C, 30 s at 55˚C and 40 s at 72˚C. The reaction product was loaded on 1% agarose gel and electrophoresed to detect a 500 bp DNA segment.
Molecular Detection of HCMV in Prostate Tissue Samples
A probe-based real-time PCR method was used to study the HCMV genome in the samples. The sequences of the primers and the probe are as follows: Forward: 5´- TGGGCGAGGACAACGAA -3´; Reverse: 5´- TGAGGCTGGGAAGCTGACAT-3´; Probe: 5´- 6- FAM- TCGGCAACCACCGCACTG- BHQ-3´. The real-time PCR reaction mix contained 1 μL of extracted DNA, 10 picomoles of the forward and the reverse primers each (1 microliter each), 8 μL Real-Time Mastermix Probe (2X qPCR for Prob, Yekta Tajhiz Azma, Iran) and sterile deionized water to attain a final volume of 16 μL.
The real-time PCR was performed on a two-channel Corbett Rotor Gene®, and the two-stage program consisted of 45 cycles of 94˚C for 30 s and 60˚C for 30 s.
The nested-PCR test was also used to detect the UL55 virus gene, using the following primers:
F1:TCCGAAGCCGAAGACTCGTA;
R1: CATTCCTCAGTGCGGTGGTT;
F2:CTGCCAAAATGACTGCAACT;
R2: ACATCACCCATGAAACGCGC.
The product of the first stage was a 755 bp segment and the product of the second stage was a 529bp segment. The reaction mix in each tube contained 10 to 50 ng of sample DNA (1 to 3 μL) 12.5 μL of PCR ready mix (2X- Super PCR master, YTA, Iran), and 0.5 μL of each of the above primers. Sterile distilled water was added to each tube to reach the final volume of 25 μL. The PCR temperature program included an initial denaturation at 95˚C for 10 min, followed by 35 cycles of 95˚C for 1 min, 55˚C for 30 s, and 72˚C for 1 min.
The content of the reaction mix and the steps of the second stage were similar to the first stage. In all steps, one positive sample known as positive control, and two negative control samples including one water and one known negative sample were used. The PCR product was loaded on 1% agarose gel and electrophoresed.
Sequencing
Purified PCR products were sequenced using the Sanger method by a commercial service provider (Pishgam Co., Iran), and the results were analyzed using Chromase software.
Statistical Analysis
The Chi-square test and Fisher's exact test were used to assess the relationship between qualitative variables, and an independent sample t-test was used to investigate the relationship between the quantitative and the MCV variables. One-way analysis of variance and the Bonferroni test were used to compare the mean values of the quantitative variables at different levels of the qualitative variables. All statistical analysis was performed on SPSS software version 19, with a significance level of 5%. Phylogenetic and bioinformatics analysis of the results was performed using CLC workbench 5 software and the NCBI BLAST tool. Phylogenetic analysis of sequences was performed using MEGA X software.
Baseline Characteristics
A total of 62 biopsy specimens in paraffin blocks were examined. Of these, 31 specimens belonging to patients with various degrees of prostate cancer were evaluated as the case group, and 31 with normal prostate malignancies were considered the control group. The mean (±SD) age of patients with severe prostate cancer and the control group was 58.8 (±14.1) years and 56.7 (±9.2) years, respectively (P=0.816). The minimum and maximum ages were 51 and 76 in the severe prostate cancer group and 49 and 75 in the control group.
Clinical Characteristics of the Studied Patients
The mean (±SD) PSA of patients with different degrees of prostate cancer is presented in Table 1. According to our results, there was a significant difference between PSA scores in different stages of the disease (P=0.044). The mean (±SD) Gleason Score (GS) in patients with prostate cancer was 7.08 (±0.78). As demonstrated in Figure 1, there was a significant difference in the mean GS score in different stages of prostate cancer (P=0.082). This difference in the staging system was significant in TNM and GS (P=0.002) (Figure 2).

Figure 1. Comparing GS scores in different stages of prostate cancer

Figure 2. Comparing GS score in terms of TNM
Table 1. PSA score in different stages of prostate cancer
| Stage | Mean | S.D. | P |
| Stage 1 | 5.0 | 0 | 0.044 |
| Stage2 | 7.1 | 2.9 | |
| Stage3 | 17.1 | 5.5 | |
| Stage4 | 8.0 | 0 |
Table 2. Relation between HCMV prevalence and prostate cancer Stage- score in terms of TNM
| Stage | HCMV | P | |||
| Positive | Negative | ||||
| N | % | N | % | ||
| III | 0 | 0 | 2 | 100 | 0.016* |
| IIA | 1 | 33.3 | 2 | 66.7 | |
| IIB | 2 | 12.5 | 14 | 87.5 | |
| III | 2 | 25 | 6 | 75 | |
| IV | 0 | 0 | 2 | 100 | |
*Fisher’s exact test
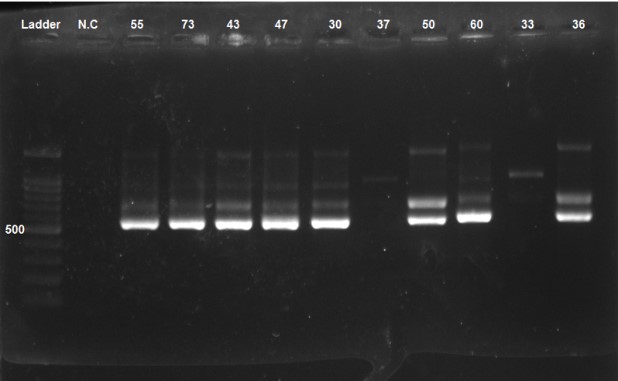
Figure 3. PCR product was loaded and electrophoresed on 1% agarose gel, showing a 529 bp. Numbers 55, 73, 43, 47, 30, 37, 50, 60, 33, and 36 are patients. NC: Negative control
The prevalence of HCMV DNA was 19.3% (n=6) in the case group and 6.5% (n=2) in the control group (Figure 3). However, there was no significant difference between the two groups in terms of HCMV prevalence (P=0.143). A significant difference (P=0.016) was observed when examining the prevalence of HCMV in different stages of prostate cancer (score in terms of TNM), with the highest prevalence (33.3%) belonging to stage IIA (Table 2).
According to different GS scores, the highest prevalence was seen in 3 + 4 and 4 + 3 scores (23.81 % and 25%, respectively). However, the difference in the prevalence of HCMV in different GS score levels was not significant (P=0.839) (Table 3). Comparison of continuous variables including age, GS score, and PSA score in HCMV-infected individuals and non-HCMV samples showed no significant difference (p>0.05) (Table 4).
Table 3. The relation between HCMV prevalence and Gleason score
| Gleason score | HCMV | P | |||
| Positive | Negative | ||||
| N | % | N | % | ||
| 3+4 | 5 | 23.81 | 16 | 76.19 | 0.839* |
| 4+3 | 1 | 25 | 3 | 75 | |
| 5+6 | 0 | 0 | 1 | 100 | |
| 6 | 0 | 0 | 3 | 100 | |
| 8 | 0 | 0 | 2 | 100 | |
| 9 | 0 | 0 | 1 | 100 | |
*Fisher’s exact test
Table 4. Comparing quantitative variables in HCMV levels
| Variables | HCMV | P | |||
| Positive | Negative | ||||
| Mean | SD | Mean | SD | ||
| Age | 63.1 | 8.5 | 57.5 | 11 | 0.415 |
| Gleason | 7 | 0 | 7.1 | 0.89 | 0.753 |
| PSA | 6.09 | 4.01 | 9.52 | 8.63 | 0.693 |
The phylogenetics assessment showed high similarity between samples isolated from Iran and other parts of the world, in that the sequences obtained from the Iranian isolates were most similar to the reference strains. The pattern of gene expression using hierarchical clustering analysis is shown in Figure 4. According to the dendrogram, the gene expression pattern is in the form of 16 clusters.

Figure 4. Dendrogram of gene expression by using hierarchical cluster analysis
The role of HCMV in human cancer has not been proven (14). HCMV is among the viruses that infect prostate tissue with oncogenic potential (25), and chronic prostate inflammation and the onset of prostate cancer result from these viral infections (26). Our results revealed the prevalence of HCMV-DNA in severe prostate cancer tumor samples and the non-malignant control group to be 19.35% (6 cases) and 6.5% (2 cases), respectively. In a similar study on prostate cancer, the prevalence of the virus was estimated at 20 percent, which is about the same as in our study, although this prevalence is higher in other cancers (27, 28). Mehrabani et al. 2016 reported the prevalence of HCMV in colorectal cancer patients to be 53.3% in the case group and 37% in the control group (29). In a meta-analysis, Bai et al. estimated the prevalence of this virus in colorectal cancer samples at 27.5%. In a review study, the prevalence of the virus in breast cancer samples was reported to be 87 percent, with the lowest prevalence in Iraq, and higher prevalences in Sudan, Australia, Iran, and New Zealand. Most Iranian studies used the PCR test (30). Studies on the association of the virus with prostate cancer did not have agreeing results (31, 32). Some studies, such as the study by Zambrano (33), emphasized the existence of a link between the prevalence of the virus and the incidence of prostate cancer. Others, such as the study by Bergh et al. in Sweden (34) and Sfanos et al. in the United States (35), concluded an absence of a relationship between the virus and the incidence of prostate cancer. For instance, Sutcliffe et al., in their study in 2013, examined the relationship between the prevalence of HCMV and the risk of prostate cancer (32). Their results showed no significant relationship between the prevalence of the virus and the risk of prostate cancer, as the virus was observed in 67% of cases and 65% of controls. Due to contradicting reports, it is evident that this area needs further investigation. The differences in the techniques used and the differences in the sexual behavior of the study population might be among the reasons for the disagreement in the results.
The GS system is the most common prostate cancer rating system (36, 37). Our study showed that the mean (±SD) GS in the samples from patients with prostate cancer was 7.08 (±0.78). According to the previously mentioned categories, the value obtained for GS in this study indicates a moderate to high status. Also, the results of our study showed that the mean GS score in different degrees of the disease was not significantly different, because the GS scores of patients were close, and other factors besides GS caused a difference in patients' grades.
The stage of most solid cancers is determined by the TNM system (38). As illustrated in Figure 3, the results of our study showed a significant difference in the mean GS score at different levels of TNM. Consistent with our research, the results of a survey by Fierro et al. showed a statistically significant difference in GS scores at different levels of TNM; Patients at higher levels of TNM also had higher GS scores (28).
When comparing the two groups of patients with HCMV and without HCMV in terms of age, GS score, and PSA score, the results indicated no significant difference. It might be due to the silent behavior of the virus and the fact that no specific age range can be assigned to it. In similar studies, no significant differences were reported between patients infected with HCMV and other groups in terms of study variables. Gleason score 3 + 4 = 7 means that the tumor still has a good prognosis, although it does not have the same prognosis as the tumor 6 Gleason score. Also, a Gleason score of 4 + 3 = 7 means that more than one tumor is likely to grow and spread, but it is not as likely to grow as a tumor with a score of 8. In our study, the prevalence of HCMV was 25% in people with a Gleason score of 3 + 4, and 24% in people with a Gleason score of 4 + 3, which indicated no statistically significant difference.
According to the dendrogram in Figure 4, Iranian HCMV isolates fit within several reference genotypes in classical clusters with a common internal node. There were close phylogenetic relationships between Iranian HCMV isolates and several reference genotypes, such as KR 534207 and MT 044483; the closest genetic relationship was observed with the KR 534207 genotype. These relationships have not been considered in previous studies. More extensive studies using more comprehensive methods and larger sample sizes are recommended to future elucidate the role of HCMV in cancer.
The present study was one of the first studies in Iran to examine the prevalence of HCMV infection and its association with prostate cancer, which can be considered the strength of this work. The small sample size was the main limitation of this study, necessitating further studies with larger sample sizes to confirm our findings.
The prevalence of HCMV in the prostate cancer group was much higher than in the control group, although this difference was not significant. Due to the oncogenicity of HCMV, more studies are needed to determine the association between HCMV and prostate cancer. There were close phylogenetic relationships between Iranian HCMV isolates and several reference genotypes, such as KR 534207 and MT 044483, of which the closest genetic relationship was observed with the KR 534207 genotype.
The prevalence of HCMV in the prostate cancer group was much higher than in the control group, although this difference was not significant. Due to the oncogenicity of HCMV, more studies are needed to determine the association between HCMV and prostate cancer. There were close phylogenetic relationships between Iranian HCMV isolates and several reference genotypes, such as KR 534207 and MT 044483, of which the closest genetic relationship was observed with the KR 534207 genotype.
Conflicts of Interest
The authors declare no conflict of interest.
SH.M designed and administrated the project. A.T and E.A. wrote the manuscript. M.S. edited manuscript. E.A. and S.J.K. performed the experiment. S.G. and D.J. analyzed the data. S.J.K. and M.F collected patients’ data and samples. All authors read and approved the final version of the manuscript.
This project was financially supported by the Iran University of Medical Sciences (Grant number: 33132).
Received: 2023/01/17 | Accepted: 2023/06/19 | ePublished: 2023/09/27
| Rights and permissions | |
 |
This work is licensed under a Creative Commons Attribution-NonCommercial 4.0 International License. |
Copyright Policy
Iranian Journal of Medical Microbiology by Farname is licensed under CC BY-NC 4.0![]()
![]()
![]()
