


![]()
![]()
![]()
BibTeX | RIS | EndNote | Medlars | ProCite | Reference Manager | RefWorks
Send citation to:
URL: http://ijmm.ir/article-1-1691-en.html


 , Sepide Kadivarian2 , Sara Kooti2 , Shirin Dashtbin3 , Ramin Abiri4 , Amirhooshang Alvandi5
2- Department of Microbiology, School of Medicine, Kermanshah University of Medical Sciences, Kermanshah, Iran
3- Department of Microbiology, School of Medicine, Iran University of Medical Sciences, Tehran, Iran
4- Fertility and Infertility Research Center, Research Institute for Health Technology, Kermanshah University of Medical Sciences, Kermanshah, Iran
5- Medical Technology Research Center, Research Institute for Health Technology, Kermanshah University of Medical Sciences, Kermanshah, Iran ,
Enterobacteriaceae and non-fermented gram-negative bacilli are the most important causes of nosocomial infections. Antimicrobial resistance among these bacteria is a serious global public health problem. One of the main reasons for treatment failure of nosocomial infections is the acquisition of antibiotic resistance genes and the development of the extended-spectrum beta-lactamase (ESBL) producing bacteria. Klebsiella pneumoniae, Escherichia coli, Pseudomonas aeruginosa, and Acinetobacter baumannii, the most important ESBL-producing organisms, are responsible for the majority of nosocomial infections (1, 2). These infectious agents become highly resistant to many antibiotics by producing the most common ESBL enzymes such as blaCTX-M, blaTEM, and blaSHV (They cause the spread of multidrug-resistant strains) (3, 4). MDR resistance patterns of a bacteria are defined as follows: If a bacterium is insensitive to at least one agent in three or more antimicrobial groups, it is considered an MDR bacterium. Despite efforts that have been made to control nosocomial infections, the mortality rate associated with ESBL-producing is still high worldwide (5). Many studies have been performed to determine the prevalence of ESBL-producing strains and genes in Iran. Therefore, due to the need for a comprehensive program and a complete registry, gathering published data as a meta-analysis could be helpful for a selection of antibiotic treatment strategies and policies (6, 7). Since no systematic review and meta-analysis study has been performed previously in Kermanshah province, we aimed to collect and analyze the data from all published articles about the prevalence of ESBL-positive gram-negative bacteria and the frequency of different ESBL genes in Kermanshah medical centers. Because the prevalence of ESBLs-producing genes plays a key role in creating a different pattern of antibiotic resistance in bacteria, knowing the prevalence of genes and screening for ESBL-producing bacteria can help implement a plan to control and treat threatening infections in the future. This helps to prevent the transmission and spread of antibiotic resistance genes as much as possible.
Search strategy and selection criteria
The data of this systematic review and meta-analysis study were collected from international and local databases, including EMBASE, Scopus, PubMed/Medline, Google Scholar, SID, and Magiran. The related keywords were extended-spectrum beta-lactamase, ESBL, β-lactams resistance, antibiotic resistance, and Kermanshah alone or combined with "AND" and/or "OR" All published studies in the field were included without time restriction until 30-Mar-2022. To conduct the present study Preferred Reporting Items for Systematic Reviews and Meta-Analysis (PRISMA) checklist for diagnostic test accuracy was considered (8).
Inclusion/exclusion criteria
Studies based on title, abstract, full text, and originality that corresponded to the study's purpose and had the study's desired characteristics were selected as eligible and entered into the study. Cohort studies, letters to editors, conferences, case reports, narrative or systematic reviews without proper data, and non-English articles were excluded.
Selection of studies and data gathering
The extracted data were checked as follows: name of the first author, year of publication, year of sample collection, medical center of sample collection, isolated bacteria, sample type, sample size, sample gender, phenotypic and genotypic methods, frequency of ESBL, multidrug resistance (MDR), Antibiotic resistance pattern, and frequency of ESBL genes.
Data statistical analysis
Using Comprehensive Meta-Analysis v2.2.064, meta-analysis and subgroup analysis were performed. The prevalence of ESBL positive cases, MDR cases, ESBL genes, and antibiotic resistance were presented with 95% confidence intervals (CIs) with the random-effects model. A subgroup analysis was performed based on the sampling years to assess the source of heterogeneity. I2 statistics and the Cochrane Q test were used to measure the studies' heterogeneity. Regarding the asymmetrical data distribution, Egger's test was used to assess potential publication bias. The P-value equal to or less than 0.05 was considered the significance threshold.
Literature search
In total, 925 relevant studies were collected by accurately searching databases using the appropriate keywords. Duplicate reports (182 articles) were removed, and the remaining 743 articles were reviewed. Based on the title/abstract, 322 articles were reviewed, and 53 relevant articles were evaluated by reading the full text. Finally, 23 studies were recognized as eligible for qualitative analysis and meta-analysis. PRISMA flow diagram of study selection is depicted in Figure 1 and the specifications extracted from the studies are shown in Table 1.
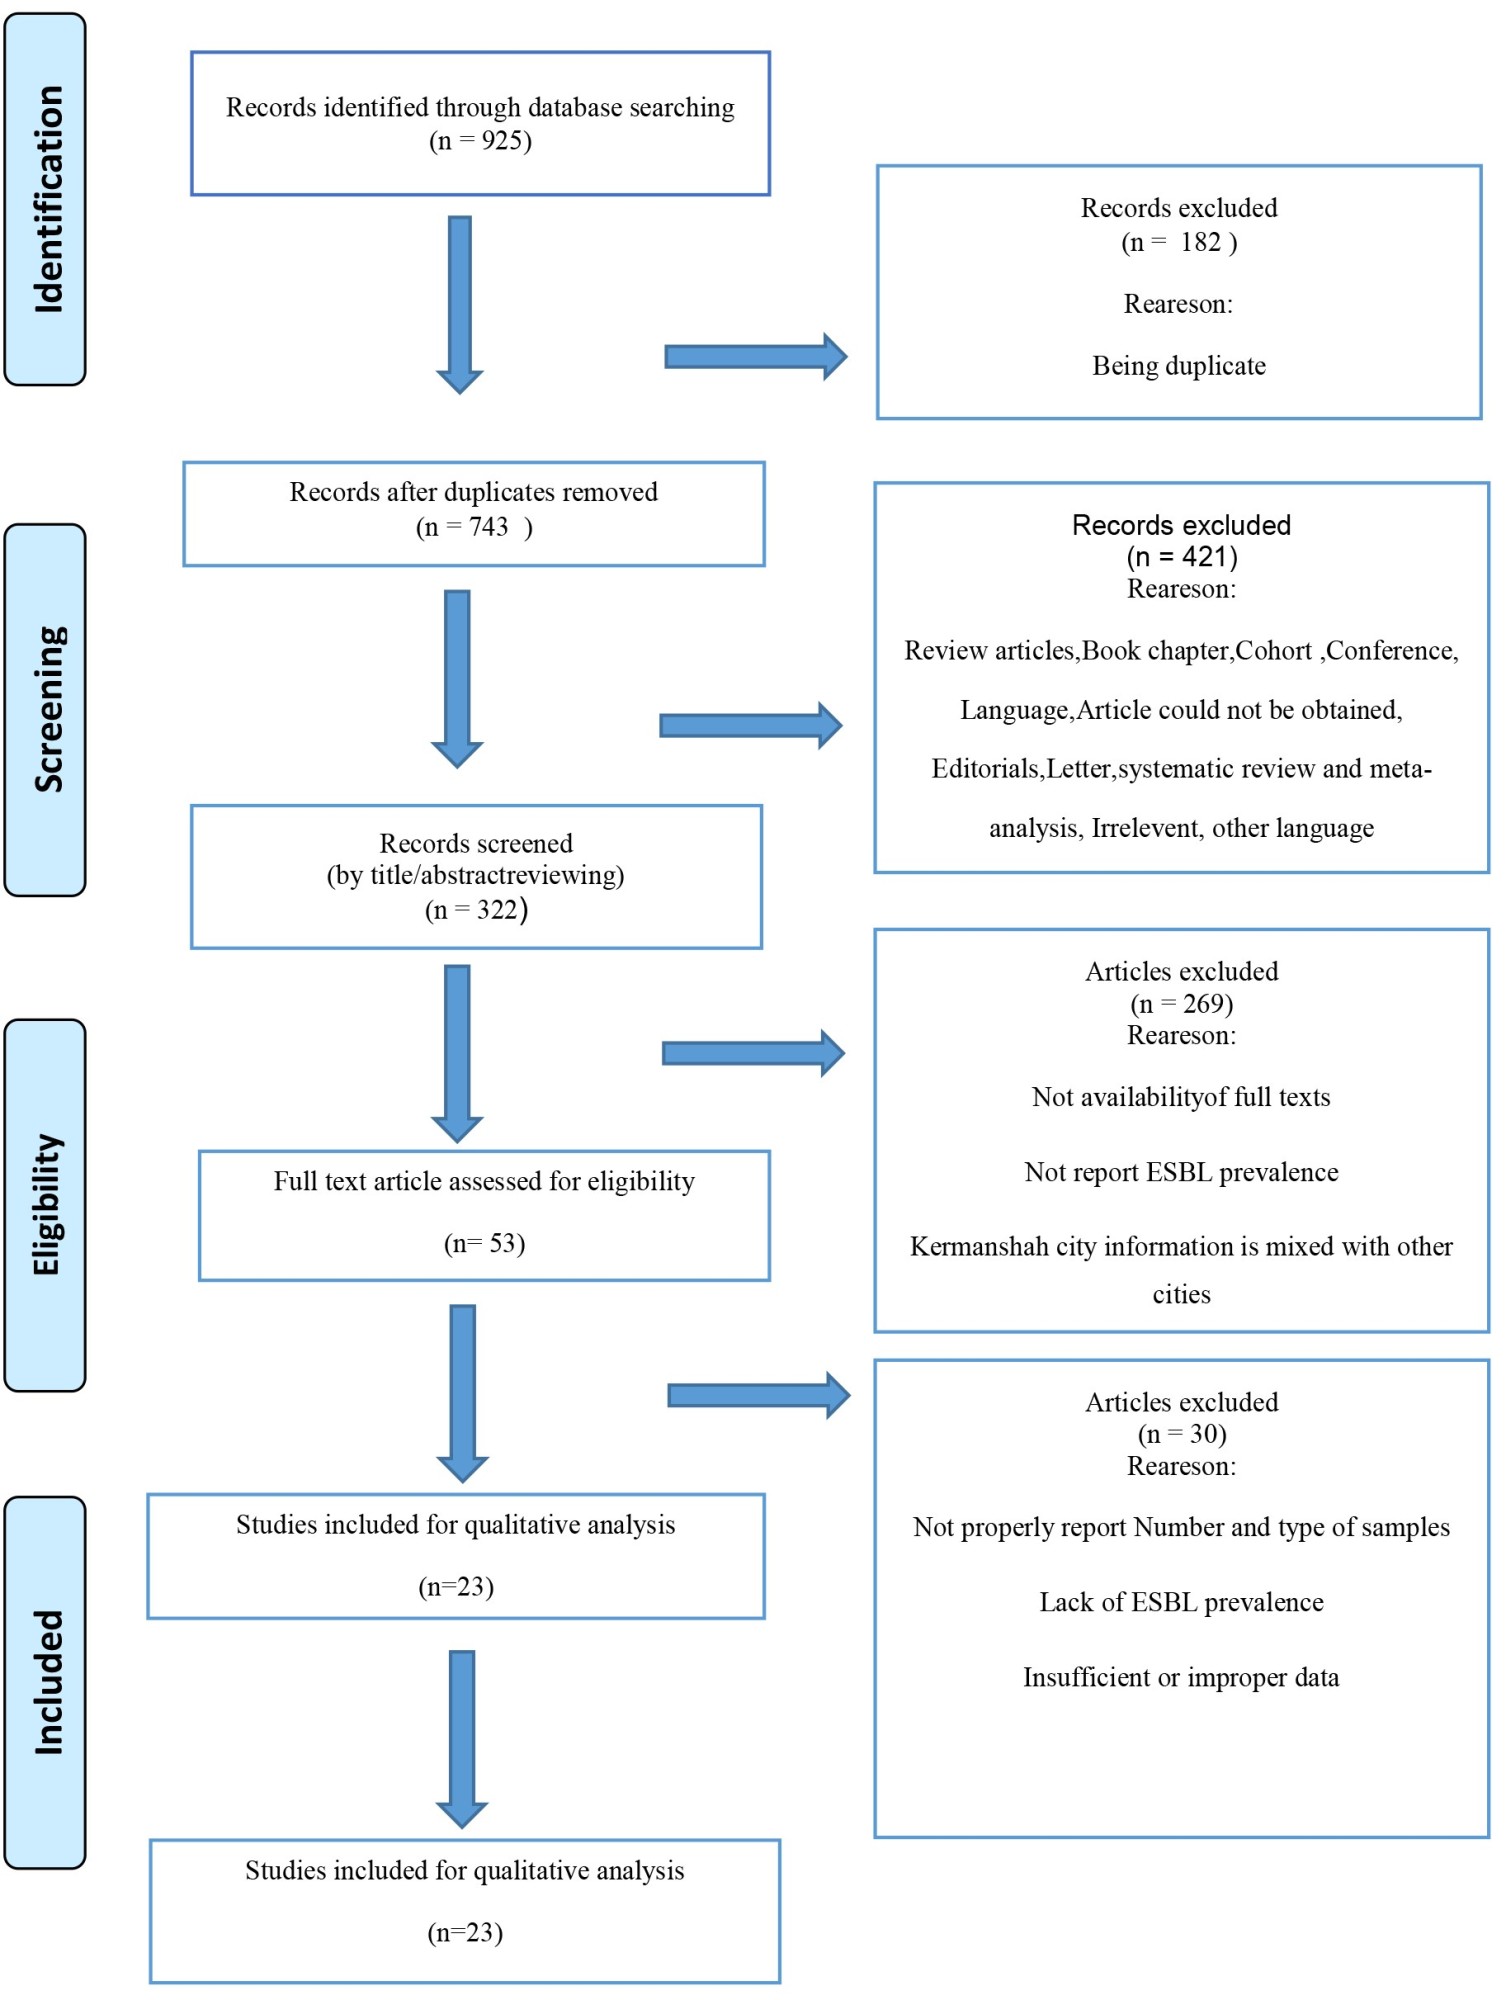
Figure 1. PRISMA flow diagram of study selection
Table 1. Studies characteristics
| Authors | Published year |
Sampling year | Sampling place | Sample type (bacteria) | Sample size | Samples include (No, %) | Male (No, %) | Female (No, %) | Phenotype method | Genotype method | Positive ESBL No. | MDR isolates No. | ESBL-producers MDR isolates No. | Reference |
| Akya et al.-1 | 2019 | 2014-2015 | Clinic University of Medical Sciences, Central Laboratory | E. coli | 240 | Urine (n = 240, 100%) | 25 (10.4%) | 215 (89.6%) | DDT, DDCT | PCR | 67 | 96 | N/A | (52) |
| Akya et al.-2 | 2018 | 2012-2013 | Imam Khomeini hospital, Taleghani hospital, Imam Reza hospital | K. pneumoniae | 100 | Urine (n = 54, 54%), Burn (n = 15, 15%), Respiratory tract secretions (n = 15, 15%), Others (blood, wound, and ascetic fluid) (n = 16, 16%) | 41 (41%) | 59 (59%) | DDT, DDCT | PCR | 40 | 56 | 40 | (53) |
| Akya et al.-3 | 2015 | 2013-2014 | Imam Reza hospital | C. freundii | 60 | Urine (n = 39, 55.7%), Stool (n = 16, 22.9%), Sputum (n = 8, 11.4%), Wound (n = 5, 7.1%), Blood (n = 2, 2.9%) | 28 (40%) | 42 (60%) | DDT, DDCT | PCR | 5 | N/A | N/A | (54) |
| C. koseri | 6 | 0 | ||||||||||||
| C. braakii | 4 | 0 | ||||||||||||
| Akya et al.-4 | 2017 | 2014-2015 | Imam Khomeini hospital, Taleghani hospital, Imam Reza hospital, Central laboratory | K. pneumoniae | 100 | Urine (n = 58, 58%), Burn (n = 16, 16%), Tracheal (n = 14, 14%), Blood (n = 5, 5%), Ascites fluid (n = 3, 3%), Wound (n = 2, 2%), Burn dressing bed (n = 1, 1%), Cot (n = 1, 1%) | 39 (39%) | 59 (59%) | DDT, DDCT | PCR | 40 | N/A | N/A | (55) |
| Azizi et al. | 2017 | 2016 | Imam Reza hospital | A. baumannii | 80 | Tracheal (n = 31, 38.75%), Urine (n = 13, 16.25%), Blood (n = 10, 12.5%), Sputum (n = 9, 11.25%), Catheter (n = 8, 10%), Wound (n = 5, 6.25%), CSF (n = 2, 2.5%), Pleural Fluid (n = 2, 2.5%) | 43 (53.8%) | 37 (46.2%) | DDT, DDCT | PCR | 43 | 50 | N/A | (56) |
| Davodian et al.-1 | 2015 | 2009-2011 | Imam Khomeini hospital | P. aeruginosa | N/A | Wound (N/A) | N/A | N/A | DDT, DDCT | PCR | 8 | N/A | N/A | (57) |
| Davodian et al.-2 | 2016 | 2009-2011 | N/A | P. aeruginosa | 10 | N/A | N/A | N/A | DDCT | PCR | 0 | N/A | N/A | (58) |
| Haidari et al. | 2015 | 2013-2014 | Imam Khomeini Taleghani Imam Reza |
P. aeruginosa | 60 | Urine (n = 9, 15%), Burn (n = 32, 53.3%), Sputum (n= 10, 16.1%), Others (blood, wound, catheter and vaginal) (n= 9, 15%) | 31 (51.7%) | 29 (48.3%) | DDT | PCR | N/A | 42 | N/A | (59) |
| Hemmati et al. | 2019 | 2017 | N/A | E. cloacae | 93 | Urine (n= 31, 33.4%), Wound (n= 18, 19.3%), Blood (n= 16, 17.2%), Trachea (n= 9, 9.7%), Sputum (n=7, 7.5%), CSF (n= 5, 5.4%), BAL (n= 4, 4.3%), Catheter (n= 3, 3.2%) | 57 (61.3%) | 36 (38.7%) | DDCT | PCR | 55 | 65 | N/A | (60) |
| Khodadoost et al. | 2013 | 2011-2012 | Clinic University of Medical Sciences | E. coli | 140 | Urine (n= 140, 100%) | 15 (10.7%) | 125 (89.3%) | DDT, DDCT | PCR | 34 | 55 | N/A | (61) |
| Mohajeri et al.-1 | 2014 | 2011-2013 | N/A | E. coli | 200 | Urine (n=200, 100%) | N/A | N/A | DDT, DDCT | PCR | 44 | N/A | N/A | (62) |
| Mohajeri et al.-2 | 2018 | 2015-2016 | Central laboratory | K. pneumoniae | 50 | Urine (n=50, 100%) | 16 (32%) | 34 (68%) | DDT, DDCT | PCR | 17 | 35 | 13 | (63) |
| Ranjbar et al. | 2019 | 2016-2018 | Imam Khomeini hospital | A. baumannii | 35 | Burn wound (n = 35, 100%) | N/A | N/A | DDT, DDST | PCR | 19 | N/A | N/A | (64) |
| Sarshar et al. | 2016 | 2014 | N/A | K. pneumoniae | 60 | Urine (n = 32, 53.3%), Burn (n = 8, 13.3%), Tracheal (n= 10, 16.6%), Blood (n = 5, 8.3%), Wound (n = 3, 5%), Bandage (n = 1, 1.6%), Cot (n = 1, 1.6%) | N/A | N/A | DDT, DDCT | PCR | 27 | 27 | N/A | (65) |
| Sarvazad et al. | 2017 | 2016 | N/A | K. pneumoniae | 97 | N/A | N/A | N/A | DDT | Multiplex-PCR | N/A | N/A | N/A | (66) |
| Vaziri et al. | 2017 | 2016-2017 | Imam Reza hospital | K. pneumoniae | 57 | Endotracheal tube (n= 384, 100%) | 36 (63.2%) | 21 (36.8%) | DDT, DDCT | PCR | 22 | N/A | N/A | (67) |
| Yousefi-Fatmesari et al. | 2017 | 2016 | Mohammad Kermanshahi hospital | E. coli | 95 | Urine (n = 95, 100%) | 53 (55.8%) | 42 (44.2%) | DDT, DDCT | PCR | 24 | N/A | N/A | (68) |
| Mohajeri et al.-3 | 2013 | 2010-2011 | Imam Reza hospital, Taleghani hospital, Imam Khomeini hospital | A. baumannii | 104 | Sputum (n = 69, 66.3%), Blood (n = 32, 30.7%), Urine (n = 3, 2.8%) | N/A | N/A | DDT, DDST | PCR | N/A | N/A | 34 | (69) |
| Akya et al.-5 | 2015 | 2013 | Imam Reza hospital | C. freundiii | 77 | N/A | N/A | N/A | DDT, MHT | PCR | N/A | N/A | N/A | (70) |
| C. koseri | 13 | |||||||||||||
| C. braakii | 9 | |||||||||||||
| CC C. youngae | 1 | |||||||||||||
| Zare et al. | 2015 | 2012-2013 | Imam Khomeini hospital, Taleghani hospital, Imam Reza hospital, Central laboratory | K. pneumoniae | 60 | Urine (n = 38, 63.33%), Burn (n = 8, 13.33%), Respiratory tract secretions (n = 5, 8.33%), Blood (n = 3, 5%), Wound (n =4, 6.67%), Sputum (n = 2, 3.33%) | N/A | N/A | DDT, MHT | PCR | N/A | N/A | N/A | (71) |
| Norozi et al. | 2014 | 2011-2013 | N/A | A. baumannii | 84 | Sputum (n= 55, 65.48%), Blood (n= 27, 32.14%), Urine (n= 2, 2.38%) | N/A | N/A | DDT, DDST | PCR | 34 | 40 | N/A | (72) |
| Mohajeri et al.-4 | 2015 | 2010-2011 | N/A | A. baumannii | 42 | Sputum (n= 36, 85.7%), Blood (n= 6, 14.3%) | 29 | 13 | DDT | PCR | N/A | 42 | N/A | (73) |
| Mohajeri et al.-5 | 2017 | 2011-2013 | N/A | A. baumannii | 75 | N/A | N/A | N/A | DDT | PCR | N/A | 37 | N/A | (74) |
*- The details of resistance genes and antibiotics susceptibility have been represented in Table 5.
Abbreviations: E. coli: Escherichia coli, K. pneumoniae: Klebsiella pneumoniae, C. freundii: Citrobacter freundii, C. koseri: Citrobacter koseri, C. braakii: Citrobacter braakii, A. baumannii: Acinetobacter baumannii, P. aeruginosa: Pseudomonas aeruginosa, E. cloacae: Enterobacter cloacae, CSF: Cerebrospinal fluid, BAL: Bronchoalveolar lavage, DDT: disk confirmatory test, DDCT: Double-disk confirmatory test, PCR: polymerase chain reaction, MDR: multidrug-resistant, N/A: not available
The prevalence of ESBL-positive bacteria in Kermanshah medical centers
To estimate the prevalence of ESBL-positive bacteria in Kermanshah medical centers, Iran, the proportion of ESBL-positive cases over sample size (i.e., event rate) was applied as effect size. The calculated event rates were multiplied by 100 for easier representation of data in the tables and the text. Fifteen studies were applied for meta-analysis, in which the pooled prevalence of ESBL-positive bacteria in Kermanshah medical centers was 34.8 % (CI 95%: 28.0 – 42.3) (Figure 2). Since the CIs of the summary effect did not include zero, the null hypothesis was rejected, indicating a positive prevalence of ESBL-positive bacteria in Kermanshah medical centers. Also, the Q-value was significantly higher than the degrees of freedom (the number of studies minus 1) (P=0.000), showing significant between-studies heterogeneity. The I2 test showed 85.44 % of true variances in the observed effects (Fig. 2).
Subgroup analysis of ESBL-positive bacteria prevalence based on the sampling year
To subgroup analysis of the ESBL-positive bacteria in Kermanshah medical centers based on the studies published year were divided into two subgroups, D1 (<2015) and D2 (2015≤). According to these subgroups, six and seven studies were categorized as D1 and D2, respectively. The prevalence of ESBL-positive bacteria was higher in D2, and there was significant heterogeneity between subgroups (Q-value: 6.347, P= 0.012) (Table 2). Table 2 shows that ESBL -positive bacteria prevalence in Kermanshah medical centers doubled after 2015.
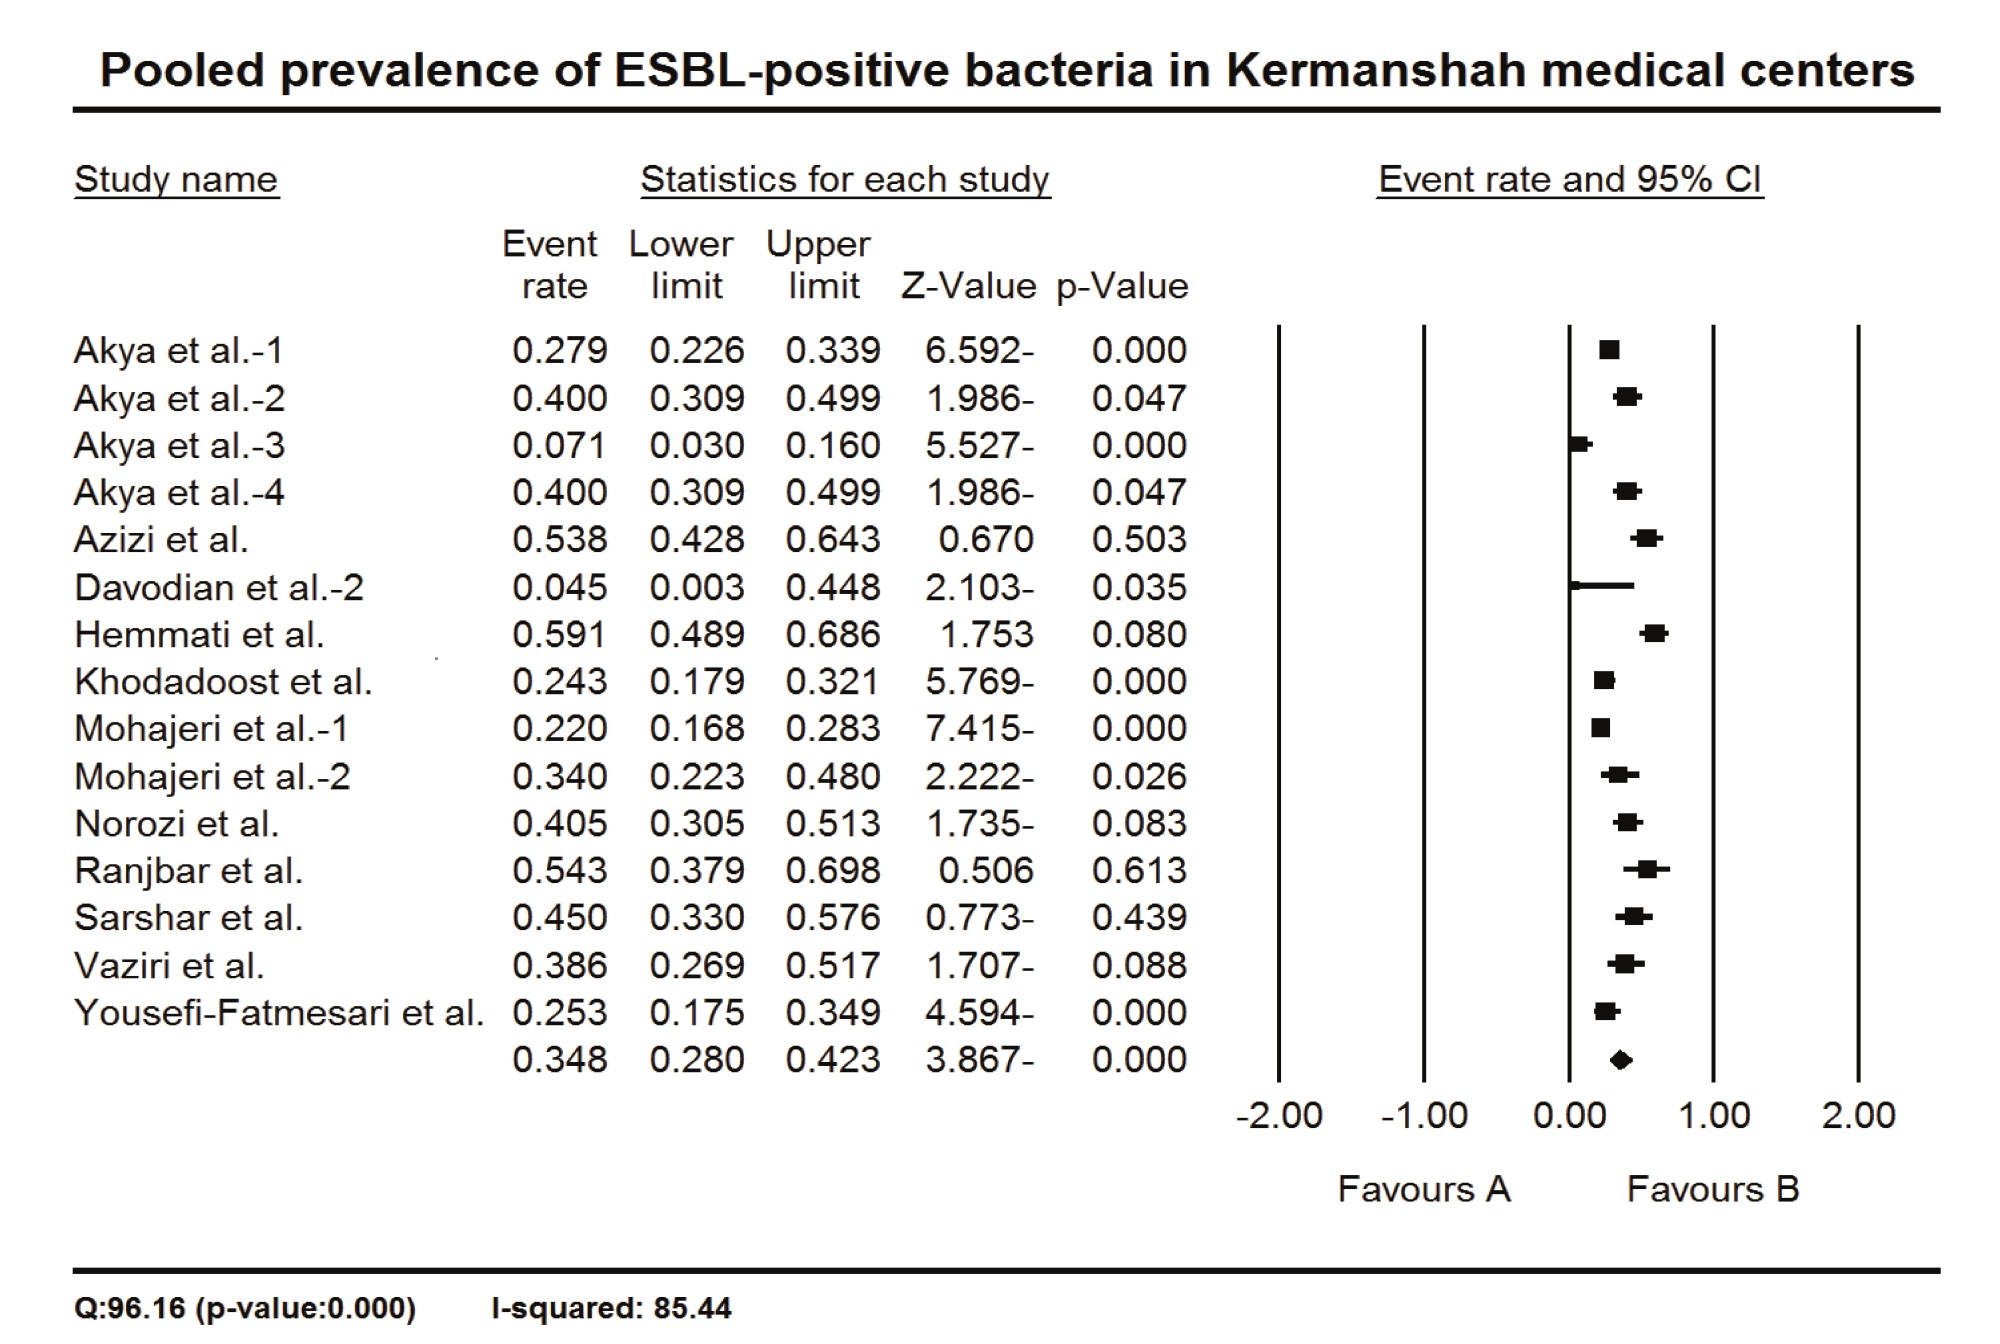
Figure 2. The pooled prevalence of ESBL-positive bacteria in Kermanshah medical center
Table 2. The prevalence of ESBL-positive bacteria in Kermanshah medical centers based on sampling years
| Group name | Sampling year | Number of studies | Prevalence (%) | Lower limit | Upper limit | Z-value | p-value |
| D1 | <2015 | 6 | 24.84 | 16.58 | 35.45 | -4.27 | 0.000 |
| D2 | 2015≤ | 7 | 43.93 | 33.56 | 54.86 | -1.09 | 0.276 |
| Overall | - | 13 | 35.14 | 27.98 | 43.03 | -3.62 | 0.000 |
Test of heterogeneity between subgroups: Q-value: 6.347, p-value: 0.012
Subgroup analysis of ESBL-positive prevalence based on the type of bacteria
Based on the type of bacteria, a subgroup analysis was done on the prevalence of ESBL-positive. The studies were divided into eight subgroups as follows: A. baumannii (3 records), C. braakii (1 study), C. freundii (1 study), C. koseri (1 study), E. cloacae (1 study), E. coli (4 studies), K. pneumoniae (5 studies), and P. aeruginosa (1 study). There was significant heterogeneity between subgroups (Q-value: 88.97, p-value: 0.000). The highest and lowest prevalence of ESBL-positive was observed for E. cloacae (59.14%) and P. aeruginosa (4.55%), respectively (Table 3).
Table 3. The prevalence of ESBL-positive bacteria in Kermanshah medical centers is based on the type of bacteria
| Group name | Number of records | Prevalence (%) | Lower limit | Upper limit | Z-value | p-value |
| A. baumannii | 3 | 48.30 | 41.37 | 55.29 | -0.48 | 0.634 |
| C. braakii | 1 | 10.00 | 0.59 | 67.36 | -1.47 | 0.140 |
| C. freundii | 1 | 8.33 | 3.51 | 18.51 | -5.13 | 0.000 |
| C. koseri | 1 | 7.14 | 0.43 | 57.72 | -1.75 | 0.081 |
| E. cloacae | 1 | 59.14 | 48.91 | 68.64 | 1.75 | 0.080 |
| E. coli | 4 | 25.11 | 21.98 | 28.53 | -12.28 | 0.000 |
| K. pneumoniae | 5 | 39.82 | 34.93 | 44.93 | -3.86 | 0.000 |
| P. aeruginosa | 1 | 4.55 | 0.28 | 44.83 | -2.10 | 0.035 |
| Overall | 17 | 34.72 | 32.17 | 37.37 | -10.77 | 0.000 |
Test of heterogeneity between subgroups: Q-value: 88.97, p-value: 0.000
The prevalence of MDR bacteria and ESBL-producing MDR bacteria in Kermanshah medical centers
The proportion of MDR cases over sample size was used to estimate the prevalence of MDR bacteria in Kermanshah medical centers. The data of 11 studies were appropriate to be included in the meta-analysis, in which the pooled prevalence of MDR bacteria in Kermanshah medical centers was 56.1% (CI 95%: 47.5 – 64.4) (Fig 3). There was also significant heterogeneity between studies indicated by a Q-value higher than degrees of freedom (p-value= 0.000) and I2 equal to 84.04% (Fig 3). The ESBL-producing MDR bacteria were only reported in three studies in which the pooled prevalence was 34.5% (CI 95%: 28.8 – 40.6), but there was no significant heterogeneity between studies (Q-value= 3.06 I2 = 34.63%) (Fig 4).

Figure 3. The pooled prevalence of MDR bacteria in Kermanshah medical centers
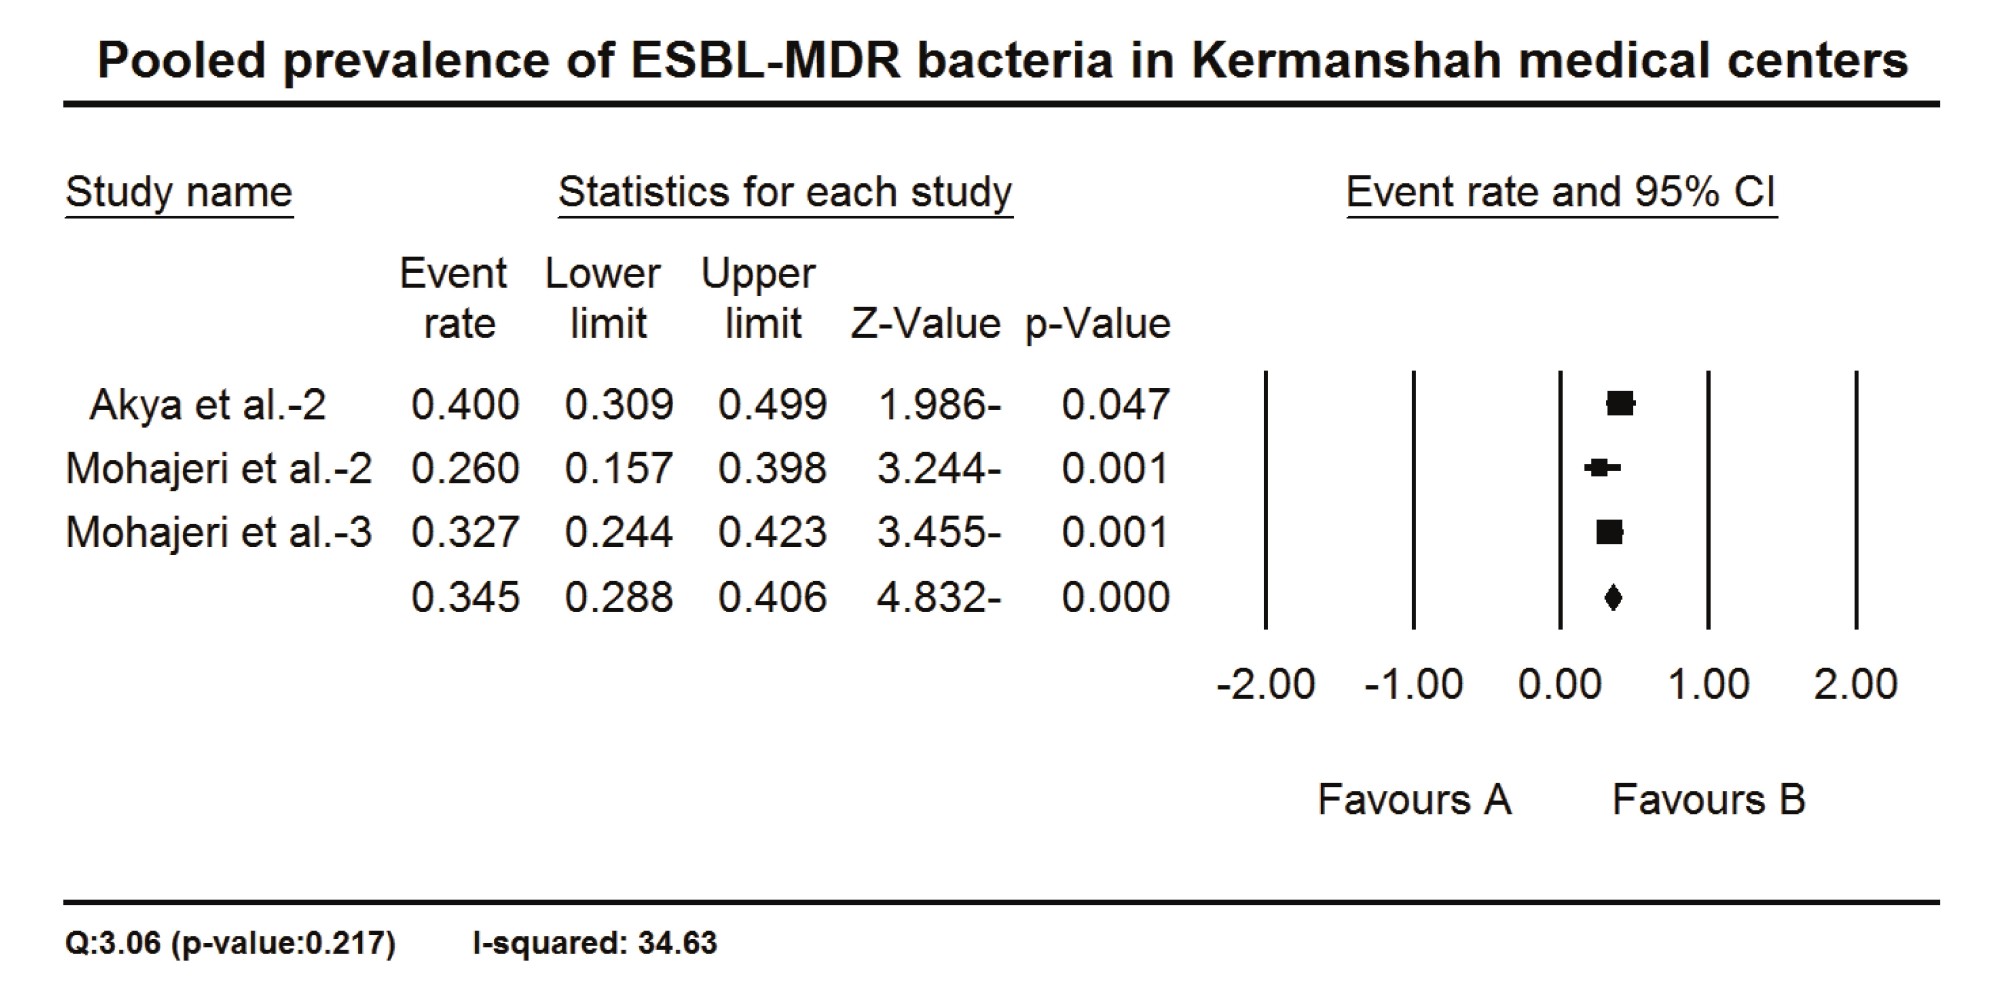
Figure 4. The pooled prevalence of ESBL-MDR bacteria in Kermanshah medical centers
The prevalence of ESBL genes in bacteria in Kermanshah medical centers
The ESBL genes evaluated in at least two studies were included in a random-effects model subgroup analysis. Nineteen genes (or gene groups) were included (Table 4), in which a significant heterogeneity existed between subgroups (Q-value: 132.42, p-value: 0.000), and the highest and lowest prevalence were observed for blaOXA-51 (99.3%) and KPC (0.6%), respectively (Table 4). The details of all genes studied have been shown in Table S1.
Table 4. The prevalence of ESBL genes in bacteria in Kermanshah medical centers based on bacteria
| Gene | Number of records | Prevalence (%) | Lower limit | Upper limit | Z-value | P-value | I2 |
| blaCTX-M | 13 | 20.2 | 13.5 | 29.1 | -5.6 | 0.000 | 78.7 |
| blaCTX-M-1 | 2 | 16.0 | 5.1 | 40.5 | -2.6 | 0.011 | 91.7 |
| blaCTX-M-2 | 2 | 1.4 | 0.3 | 6.9 | -5.1 | 0.000 | 65.8 |
| blaCTX-M-3 | 2 | 13.2 | 4.1 | 34.8 | -2.9 | 0.003 | 88.2 |
| blaOXA-23like | 4 | 80.0 | 62.7 | 90.6 | 3.1 | 0.002 | 71.0 |
| blaOXA-23like + blaOXA-24 like | 2 | 20.7 | 7.2 | 46.7 | -2.2 | 0.030 | 45.6 |
| blaOXA-24 like | 4 | 22.9 | 11.2 | 41.0 | -2.8 | 0.005 | 9.7 |
| blaOXA-51 | 3 | 99.3 | 95.8 | 99.9 | 5.3 | 0.000 | 0.0 |
| blaOXA-58 | 3 | 0.7 | 0.1 | 4.2 | -5.3 | 0.000 | 0.0 |
| blaPER | 2 | 4.2 | 0.9 | 17.9 | -3.8 | 0.000 | 73.6 |
| blaPER-1 | 2 | 23.4 | 6.1 | 58.8 | -1.5 | 0.132 | 61.2 |
| blaSHV | 11 | 21.5 | 13.6 | 32.3 | -4.6 | 0.000 | 95.3 |
| blaTEM | 11 | 15.1 | 9.6 | 23.0 | -6.5 | 0.000 | 58.2 |
| blaVEB-1 | 2 | 2.5 | 0.3 | 20.3 | -3.1 | 0.002 | 0.0 |
| KPC | 2 | 0.6 | 0.1 | 5.8 | -4.4 | 0.000 | 0.0 |
| SHV+ TEM | 3 | 18.7 | 7.6 | 38.9 | -2.8 | 0.005 | 92.8 |
| SHV+ TEM +blaCTX-M | 3 | 17.6 | 7.0 | 37.8 | -2.9 | 0.004 | 92.8 |
| SHV+blaCTX-M | 2 | 26.8 | 10.1 | 54.3 | -1.7 | 0.095 | 0.0 |
| TEM +blaCTX-M | 4 | 14.8 | 6.5 | 30.4 | -3.7 | 0.000 | 94.6 |
| Overall | 77 | 20.1 | 16.9 | 23.8 | -12.6 | 0.000 | 91.6 |
Test of heterogeneity between subgroups: Q-value: 132.42, p-value: 0.000
The prevalence of antibiotic resistance in bacteria in Kermanshah medical centers
For a random-effects model meta-analysis, the antibiotics reported in at least two studies were included. These antibiotics were Ampicillin (AMP), Ceftriaxone (CRO), Cefotaxime (CTX), Ceftazidime (CAZ), Aztreonam (ATM), Imipenem (IMI), Piperacillin (PIP), Trimethoprim/sulfamethoxazole (SXT), Ciprofloxacin (CIP), Gentamicin (GEN), Amikacin (AMK), Nitrofurantoin (NIT), Meropenem (MEM), Rifampin (RIF), Tetracycline (TET), Gatifloxacin (GAT), Colistin (CST), Polymyxin B (Poly-B), Levofloxacin (LVX), Minocycline (MIN), Mezlocillin (MEZ), Tobramycin (TOB), Tigecycline (TIG), Cefepime (FEP), Cefpodoxime (CPD), AMP-Sulbactam (AMP-SUL), Nalidixic acid (NALA), Piperacillin /tazobactam (TZP), Cefazolin (CFZ), Ertapenem (ETP), Cefixime (CFM) (Table 5). The analysis showed significant between-subgroups heterogeneity (Q-value: 197.62, p-value: 0.000). The highest and lowest resistance was estimated to be MEZ (92.2%) and TIG (4.2%), respectively (Table 5).
Table 5. The prevalence of antibiotic resistance in bacteria in Kermanshah medical centers
| Antibiotics | Number of records | Prevalence (%) | Lower limit | Upper limit | Z-value | P-value | I2 |
| AMK | 9 | 67.5 | 51.0 | 80.6 | 2.1 | 0.038 | 88.9 |
| AMP | 9 | 86.0 | 73.9 | 93.0 | 4.6 | 0.000 | 90.6 |
| AMP-SUL | 4 | 39.4 | 19.0 | 64.3 | -0.8 | 0.409 | 90.6 |
| ATM | 8 | 39.3 | 24.0 | 56.9 | -1.2 | 0.232 | 91.0 |
| CAZ | 16 | 60.6 | 47.7 | 72.1 | 1.6 | 0.107 | 94.1 |
| CFM | 2 | 68.3 | 34.2 | 90.0 | 1.1 | 0.289 | 0.0 |
| CFZ | 4 | 85.7 | 66.7 | 94.8 | 3.2 | 0.001 | 89.3 |
| CIP | 13 | 57.5 | 43.1 | 70.7 | 1.0 | 0.306 | 93.7 |
| CPD | 9 | 67.6 | 50.6 | 80.9 | 2.0 | 0.042 | 91.3 |
| CRO | 13 | 64.2 | 49.3 | 76.8 | 1.9 | 0.061 | 93.7 |
| CST | 6 | 17.7 | 7.9 | 35.3 | -3.2 | 0.001 | 91.5 |
| CTX | 14 | 67.4 | 54.0 | 78.5 | 2.5 | 0.012 | 94.6 |
| ETP | 4 | 5.4 | 1.7 | 15.7 | -4.7 | 0.000 | 65.2 |
| FEP | 8 | 72.7 | 55.7 | 84.9 | 2.6 | 0.011 | 90.3 |
| GAT | 4 | 63.3 | 38.3 | 82.7 | 1.0 | 0.296 | 76.1 |
| GEN | 13 | 45.6 | 32.1 | 59.7 | -0.6 | 0.541 | 95.2 |
| IMI | 15 | 37.0 | 24.7 | 51.2 | -1.8 | 0.072 | 96.3 |
| LVX | 6 | 77.3 | 59.6 | 88.8 | 2.9 | 0.004 | 57.2 |
| MEM | 10 | 51.0 | 34.2 | 67.6 | 0.1 | 0.908 | 95.6 |
| MEZ | 4 | 92.2 | 79.0 | 97.4 | 4.2 | 0.000 | 60.8 |
| MIN | 4 | 26.3 | 11.4 | 49.7 | -2.0 | 0.048 | 0.0 |
| NALA | 3 | 65.7 | 37.3 | 86.1 | 1.1 | 0.276 | 82.9 |
| NIT | 3 | 39.3 | 16.6 | 67.8 | -0.7 | 0.469 | 95.5 |
| PIP | 5 | 84.4 | 67.0 | 93.5 | 3.4 | 0.001 | 79.8 |
| Poly-B | 5 | 15.3 | 6.7 | 31.4 | -3.6 | 0.000 | 0.0 |
| RIF | 3 | 91.4 | 75.1 | 97.4 | 3.7 | 0.000 | 0.0 |
| SXT | 11 | 56.1 | 41.0 | 70.2 | 0.8 | 0.428 | 87.4 |
| TET | 6 | 73.4 | 54.3 | 86.5 | 2.4 | 0.018 | 82.1 |
| TIG | 4 | 4.2 | 1.4 | 12.1 | -5.3 | 0.000 | 0.0 |
| TOB | 10 | 44.0 | 29.3 | 59.8 | -0.7 | 0.457 | 90.3 |
| TZP | 6 | 34.1 | 18.0 | 54.8 | -1.5 | 0.129 | 94.8 |
| Overall | 231 | 55.6 | 52.2 | 59.0 | 3.2 | 0.002 | 94.2 |
Test of heterogeneity between subgroups: Q-value: 197.62, p-value: 0.000
Abbreviations: Ampicillin (AMP), Ceftriaxone (CRO), Cefotaxime (CTX), Ceftazidime (CAZ), Aztreonam (ATM), Imipenem (IMI), Piperacillin (PIP), Trimethoprim/sulfamethoxazole (SXT), Ciprofloxacin (CIP), Gentamicin (GEN), Amikacine (AMK), Nitrofurantoin (NIT), Meropenem (MEM), Rifampin (RIF), Tetracycline (TET), Gatifloxacin (GAT), Colistin (CST), Polymyxin B (Poly-B), Levofloxacin (LVX), Minocycline (MIN), Mezlocillin (MEZ), Tobramycin (TOB), Tigecycline (TIG), Cefepime (FEP), Cefpodoxime (CPD), AMP-Sulbactam (AMP-SUL), Nalidixic acid (NALA), Piperacillin/tazobactam (TZP), Cefazolin (CFZ), Ertapenem (ETP), Cefixime (CFM)
Publication bias
The prevalence of ESBL-positive bacteria was applied for Egger's test to evaluate the potential publication bias. The test indicated no bias in the reports on the prevalence of ESBL-positive bacteria in Kermanshah medical centers (p-value=0.464).
Despite many studies on the prevalence of ESBL-producing bacteria in various clinical specimens worldwide, the growing global trend of ESBL-producing bacteria indicates a lack of regular monitoring and implementation of appropriate control programs by health care systems (9-11). The first step in controlling resistant pathogens is identifying their prevalence and characteristics. In this regard, systematic review and meta-analysis studies will assist in estimating these parameters by collecting all relevant studies in this field. The present study was the first systematic review and meta-analysis of ESBL-producing gram-negative bacteria in various medical centers in Kermanshah. As our results showed, the pooled prevalence of ESBL-positive gram-negative bacteria in medical centers Kermanshah medical centers was 34.8 %, which is between the range reported for the global prevalence of ESBL-positive gram-negative bacteria (1.9% and 53%) (12). A systematic review and meta-analysis study estimated the prevalence of ESBL in gram-negative bacteria worldwide at 25% (13). The prevalence of ESBL has been reported from 45% in Africa to 3% in North America (13). As compared to other regions of Iran, the pooled prevalence of ESBL-positive gram-negative bacteria in Kermanshah medical centers was higher than the global level (13) and lower than in China (14), Nigeria (15), and Ethiopia (16).
Compared to other regions of the world, the pooled prevalence of ESBL-positive gram-negative bacteria in our study was lower than that was reported for Pakistan (17), Afghanistan (18), China (14), South-East Asia, and the African area (19), with the frequency of 40%, 51.9%, 46%, 37%, and 76% respectively. At the same time, it was higher than that was reported for Europe, the Americas, and the Eastern Mediterranean (19) with the frequency of 10.19%, 2%, and 5%. The differential in ESBL incidence in these studies might be explained by several factors, including differences in geographic location and socioeconomic condition (20), differences in the diagnostic methods, procedures, and performance (17), the studies aim (11), the availability of medications, and type of infection, species, and hospital/ward.
Our results also showed that the prevalence of ESBL-producing gram-negative bacteria in Kermanshah medical centers has been increasing in recent years, which is similar to the findings of meta-analysis studies in Ethiopia (19), Tunisia (21-24), and India (25). The increasing prevalence of these resistant strains is a cause for concern and emphasizes the need to pay more attention to care and control systems.
The appearance of ESBL-producing E. cloacae in clinical isolates poses a significant challenge to nosocomial infection treatment (26). Our study, the highest prevalence of ESBL-positive bacteria was observed for E. cloacae. In our study, Ali et al., found a high frequency of 79 % ESBL-producing E. cloacae among clinical isolates obtained from the Military Hospital in Rawalpindi (27). Similarly, according to a study done at the Aga Khan University Hospital in Karachi, Pakistan, 50% of E. cloacae strains were positive for ESBL (28). Also, the frequency of A. baumannii, K. pneumoniae, and E. coli producing ESBL was high in our study, which is consistent with previous studies done in Iran (29, 30). In a comprehensive study in Iran, the prevalence of ESBL-positive E. coli was 89.8% (29). In a meta-analysis in Iran, the prevalence of ESBL-positive K. pneumoniae was estimated at 43.5% (31). Similarly, in some other parts of the world, including Ethiopia (32), Saudi Arabia (33), the United Arab Emirates (34), and Tunisia (35), the prevalence of ESBL-positive K. pneumoniae was higher than that was estimated in our study. The increasing prevalence of ESBL-producing K. pneumoniae and E. coli strains is worrying and requires implementing policies and regional/global efforts to reduce this ascending prevalence.
Multidrug resistance (MDR) bacteria were found in 56.1 % of Kermanshah medical institutions (34.5% in ESBL-positive strains). In Iran, according to a meta-analysis study, the prevalence of MDR ranged from 32.8% in K. pneumoniae strains to 58% (32) in P. aeruginosa strains (36). In other regions of the world, the prevalence of MDR varies in a European study; it ranged from 0% in Estonia and Iceland to 49.4% in Romania (37). In Ethiopia, the total prevalence of MDR was 69.9% (38). The main reason for increasing and disseminating MDR strains is the unnecessary and excessive use of antibiotics that may lead to the acquisition of drug-resistance elements (39-41).
Understanding the diversity of ESBL-producing genes is important to identify the genes responsible for multi-resistance patterns (42). Our results showed that Ambler class D genes (blaOXA genes) were the most common ESBL genes, followed by Ambler class A gene. Similar to our results, Oliveira et al. found that the majority of isolates (96.5 %) were positive for blaOXA-51 in their investigation from two general hospitals in Brazil [26]. However, in contrast to our results, in some studies, blaTEM, blaCTX-M, and blaSHV (but not blaOXA) genes have been identified as the most common genes encoding ESBL (30, 43-46). The lowest prevalence was observed for KPC genes in our study (0.6%), similar to that reported by Yang et al., in a Chinese hospital that found a low prevalence of 2.9% for KPC-positive K. pneumonia (47). Differences in ESBL genes may be due to the differences in socioeconomic status, geographical areas, and the quality of diagnostic methods (48).
In our study, the highest resistance was estimated to be MEZ (92.2%). Following our study, the high resistance rates to MEZ (50%) were reported by Ozer et al. (49). Also, several more studies have revealed the high prevalence of resistance to MEZ in recent years (50, 51). This indicates that MEZ should be less used, and other alternative antibiotics should be used to treat the infections caused by ESBL-positive bacteria.
A limitation of our study is the low number of studies included, so only 15 studies were qualified to be included in which only three studies reported ESBL-producing MDR bacteria. In addition, ESBL genotypes were reported in only two studies. In the future, more studies are recommended to ensure the prevalence of ESBL-producing bacteria in Kermanshah.
Altogether, this systematic review and meta-analysis showed that the prevalence of ESBL-positive and MDR bacteria is high in Kermanshah medical centers. It provides significant information to health policymakers to implement appropriate strategies to reduce the prevalence of resistant bacteria.
The authors of this article express their gratitude and appreciation to the Vice Chancellor for Research and Technology of the Kermanshah University of Medical Science.
Conflicts of Interest
Nothing to declare.
No funding.
The study was done under the supervision of the Ethical Committee of Kermanshah University of Medical Sciences (ethical code IR. KUMS. REC.1400.021).
Received: 2022/03/6 | Accepted: 2022/06/28 | ePublished: 2022/09/9
| Rights and permissions | |
 |
This work is licensed under a Creative Commons Attribution-NonCommercial 4.0 International License. |
Copyright Policy
Iranian Journal of Medical Microbiology by Farname is licensed under CC BY-NC 4.0![]()
![]()
![]()
