


![]()
![]()
![]()
BibTeX | RIS | EndNote | Medlars | ProCite | Reference Manager | RefWorks
Send citation to:
URL: http://ijmm.ir/article-1-1613-en.html


2- Department of Biological Science, Florida State University, Tallahassee, Florida, USA
3- Cellular and Molecular Research Center, Research Institute for Prevention of Non-Communicable Diseases, Qazvin University of Medical Sciences, Qazvin, Iran ,
Urinary tract infections (UTIs) are considered a critical public health obstacle caused by various bacterial agents (1). Throughout the world, around 150 million cases are distinguished with UTIs per year (2). In clinics, UTIs are classified as uncomplicated or complicated. Uncomplicated UTIs routinely influence healthy people without neurological or structural urinary tract problems (3). Complicated UTIs are linked to urinary obstruction, host defense, neurological disease, renal failure, immunosuppression, renal transplantation, pregnancy, and others (4). UTIs can be detected using a combination of clinical symptoms and bacterial tests (5). Bacteriologically, the causative agents of UTIs, are anticipated, and typically most of the infections in communities are caused by gram-negative bacteria, facultative anaerobes. In other words, Escherichia coli is responsible for more than half of the UTIs in women between 18 to 39 years (6, 7). Generally, it should be noted that UTIs are caused by gram-negative and positive bacteria (8). The most common reported bacteria from UTIs are Escherichia, Klebsiella, Enterococcus, Enterobacter, Streptococcus, Proteus, Staphylococcus, Citrobacter, Pseudomonas, etc. (9). Symptomatic UTIs are commonly treated with antibiotics, which in turn can alter the gut microbiota and vagina which eventually can lead to the development of multidrug-resistant bacteria (10). The expansion of antimicrobial resistance among pathogens, both in the community and in hospitals, is increasing due to various factors, including the misuse of antibiotics when feeding animals, over-administration of antibiotics, and poor infection control strategies worldwide (11). Since UTIs result in the high rate and emergence of antibiotic resistance, it is required to increase information about the prevalence of UTIs and determine their antimicrobial resistance patterns (12). When it comes to choosing the most suitable antibiotics and preventing unfinished treatments, it is crucial to determine the antibacterial susceptibility patterns of UTIs (10). Accordingly, the objectives of this study were to evaluate the prevalence rate of UTIs with antimicrobial susceptibility patterns in patients referred to Mehr clinical Laboratory, Qazvin, Iran.
Study Area, Study Period, and Study Population
Qazvin is the largest city and capital of the Qazvin Province, with 1,300,000 habitants in Iran, which is located northwest of Tehran. This retrospective cross-sectional study was conducted on 3521 patients with and without clinical symptoms of UTI referred to Mehr laboratory, Qazvin, Iran, between April 2017 and January 2019. The age range was between 4 months to 85 years which was classified into seven groups including less than one year, one to ten years, eleven to twenty years, twenty-one to thirty years, thirty-one to forty years, forty-one to fifty years and more than fifty-one years. This study was approved by the Ethical Committee of Qazvin University of Medical Sciences (IR.QUMS.REC.1400.324).
Identification of Bacterial Isolates
Clean-voided midstream urine of the patients was collected into a sterile container (40 ml) and carried to the technical department of the laboratory to be conducted by trained personnel. A 0.01-ml platinum loop was used to inoculate a sheep blood agar and MacConkey agar plate for quantitative culture (Pronadisa media). All plates were incubated at 37°C for 24 h (13, 14). All cultures with equal or greater than 104 colony-forming units (CFU) per milliliter of single or two types of colony pathogen were accepted, and the cultures result in 102-104 CFU/ml were repeated. A less than 102 CFU/ml was excluded (15). Correlation between UTIs and host characteristics was done using chi-square. Data were analyzed, and statistical comparisons were carried out using SPSS 16.0 (SPSS Inc., Chicago, IL., USA).
Antimicrobial Susceptibility
Susceptibilities to 9 antimicrobial agents of 5 different classes were determined by the disc diffusion method as described by CLSI guidelines using Mueller- Hinton agar (pronadisa) and commercial antibiotic discs (Mast, Bootle, UK). Bacterial suspensions of 0.5 McFarland (1.5 × 10⁸ colony-forming unit/ ml) were prepared in 0.85% saline solution and passaged onto Mueller-Hinton agar by sterile rayon swabs. Antibiotic discs were dispensed onto the passaged plates. The plates were incubated at 35 °C for 18 hours. The antimicrobial agents were as followes: Amikacin (30 µg), Ciprofloxacin (5 µg), Ceftriaxone (30 µg), Gentamicin (10 µg), Nalidixic acid (30 µg), Nitrofurantoin (300 µg), Trimethoprim/sulfamethoxazole (1.25/23.75 µg), Cephalexin (30 µg), and Erythromycin (15 µg).
From 3521 patients (8.1% males and 91.9% females) referred to Mehr laboratory, 347 pathogens were isolated. The overall infection rate of UTIs was calculated at 9.9%. Figure 1 shows the profile of bacteria isolated from the urine samples. A total of 347 bacterial isolates were obtained. The most frequent isolate was Escherichia coli, while Pseudomonas aeruginosa least frequently occurred in the urine samples. Statistically, a significant difference was observed between UTIs and age (P<0.05). Figure 2 shows the frequency and percentage of UTIs based on age. More cases of UTIs were seen in the group 20 to 30 years old. Table 1 shows the percentage of gram-negative bacteria isolates susceptible to antimicrobial agents. All the bacterial isolates were most susceptible to Nitrofurantoin and Ciprofloxacin. Table 2 shows the percentage of gram-positive bacteria isolates susceptible to antimicrobial agents. All the bacterial isolates were most sensitive to Amikacin.
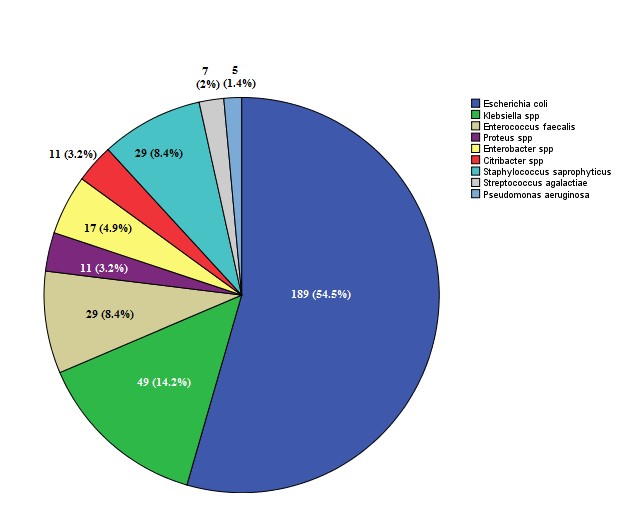
Figure 1. Numbers of bacterial agents were respectively isolated from urine. (Frequency and percentage).
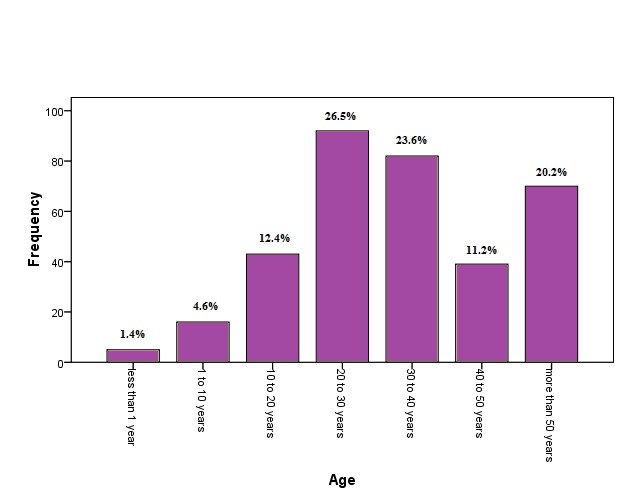
Figure 2. The frequency and percentage of UTIs based on age.
Table 1. Antibiotic susceptibility testing of gram-negative isolated strains. Frequency and percentage.
| Antibiotic susceptibility patterns | |||||||
| Bacterial isolates | Susceptibility | GM | NA | SXT | CP | FM | CRO |
| Escherichia coli | S | 136 (72.0%) |
56 (29.6%) |
69 (36.5%) |
120 (63.5%) |
142 (75.1%) |
103 (54.5%) |
| I | 45 (23.8%) |
35 (18.5%) |
36 (19.0%) |
19 (10.1%) |
40 (21.2%) |
8 (4.2%) |
|
| R | 8 (4.2%) |
98 (51.9%) |
84 (44.4%) |
50 (26.5%) |
7 (3.7%) |
78 (41.3%) |
|
| Klebsiella spp | S | 19 (38.8%) |
3 (6.1%) |
15 (30.6%) |
27 (55.1%) |
15 (30.6%) |
20 (40.8%) |
| I | 14 (28.6%) |
5 (10.2%) |
3 (6.1%) |
6 (12.2%) |
5 (10.2%) |
3 (6.1%) |
|
| R | 16 (32.7%) |
41 (83.7%) |
31 (63.3%) |
16 (32.7%) |
29 (59.2%) |
26 (53.1%) |
|
| Enterobacter spp | S | 5 (29.4%) |
2 (11.8%) |
5 (29.4%) |
3 (17.6%) |
10 (58.8%) |
3 (17.6%) |
| I | 3 (17.6%) |
0 (0.0%) |
4 (23.5%) |
1 (5.9%) |
4 (23.5%) |
2 (11.8%) |
|
| R | 9 (52.9%) |
15 (88.2%) |
8 (47.1%) |
13 (76.5%) |
3 (17.6%) |
12 (70.6%) |
|
| Proteus spp | S | 4 (36.4%) |
0 (0.0%) |
4 (36.4%) |
9 (81.8%) |
6 (54.5%) |
9 (81.8%) |
| I | 1 (9.1%) |
0 (0.0%) |
1 (9.1%) |
2 (18.2%) |
1 (9.1%) |
1 (9.1%) |
|
| R | 6 (54.5%) |
11 (100.0%) |
6 (54.5%) |
0 (0.0%) |
4 (36.4%) |
1 (9.1%) |
|
| Citribacter spp, | S | 5 (45.5%) |
1 (9.1%) |
3 (27.3%) |
10 (90.9%) |
5 (45.5%) |
6 (54.5%) |
| I | 2 (18.2%) |
2 (18.2%) |
0 (0.0%) |
0 (0.0%) |
4 (36.4%) |
1 (9.1%) |
|
| R | 4 (36.4%) |
8 (72.8%) |
8 (72.7%) |
1 (9.1%) |
2 (18.2%) |
4 (36.4%) |
|
| Pseudomonas aeruginosa | S | 1 (20.0%) |
0 (0.0%) |
0 (0.0%) |
1 (20.0%) |
0 (0.0%) |
1 (20.0%) |
| I | 0 (0.0%) |
0 (0.0%) |
0 (0.0%) |
0 (0.0%) |
0 (0.0%) |
1 (20.0%) |
|
| R | 4 (80.0%) |
5 (100.0%) |
5 (100.0%) |
4 (80.0%) |
5 (100.0%) |
3 (60.0%) |
|
| Total | S | 170 (60.3%) |
62 (22.0%) |
96 (34.0%) |
170 (60.3%) |
178 (63.1%) |
142 (50.4%) |
| I | 65 (23%) |
42 (14.9%) |
44 (15.6%) |
28 (9.9%) |
54 (19.1%) |
16 (5.7%) |
|
| R | 47 (16.7%) |
178 (63.1%) |
142 (50.4%) |
84 (29.8%) |
50 (17.7%) |
124 (44.0%) |
|
GM; Gentamicin, NA; Nalidixic acid, SXT; Trimethoprim/sulfamethoxazole, CP; Ciprofloxacin, FM; Nitrofurantoin, CRO; Ceftriaxone
Table 2. Antibiotic susceptibility testing of gram-positive isolated strains. Frequency and percentage.
| Antibiotic susceptibility patterns | |||||||
| Bacterial isolates | Susceptibility | GM | AN | SXT | CP | CN | E |
| Enterococcus faecalis | S | 19 (65.5%) |
17 (58.6%) |
1 (3.4%) |
1 (3.4%) |
15 (51.7%) |
3 (10.3%) |
| I | 10 (34.5%) |
2 (6.9%) |
2 (6.9%) |
6 (20.7%) |
3 (10.3%) |
8 (27.6%) |
|
| R | 0 (0.0%) |
10 (34.5%) |
26 (89.7%) |
22 (75.9%) |
11 (37.9%) |
18 (62.1%) |
|
| Staphylococcus saprophyticus |
S | 10 (34.5%) |
23 (79.3%) |
5 (17.2%) |
14 (48.3%) |
5 (17.2%) |
16 (55.2%) |
| I | 8 (27.6%) |
2 (6.9%) |
2 (6.9%) |
6 (20.7%) |
2 (6.9%) |
6 (20.7%) |
|
| R | 11 (37.9%) |
4 (13.8%) |
22 (75.9%) |
9 (31.0%) |
22 (75.9%) |
7 (24.1%) |
|
| Total | S | 29 (50.0%) |
40 (69.0%) |
6 (10.3%) |
15 (25.9%) |
20 (34.5%) |
19 (32.8%) |
| I | 18 (31.0%) |
4 (6.9%) |
4 (6.9%) |
12 (20.7%) |
5 (8.6%) |
14 (24.1%) |
|
| R | 11 (19.0%) |
14 (24.1%) |
48 (82.8%) |
31 (53.4%) |
33 (56.9%) |
25 (43.1%) |
|
GM; Gentamicin, AN; Amikacin, SXT; Trimethoprim/sulfamethoxazole, CP; Ciprofloxacin, CN; cephalexin, E; Erythromycin
UTIs are one of the most prominent common infectious diseases affecting all age groups (16, 17). Escherichia coli is perceived as an etiological agent in the community. Other UTI agents include species of Klebsiella, Proteus, Enterobacter, Staphylococcus, Pseudomonas, Enterococcus faecalis, and Streptococcus (18).
This study was conducted to determine the prevalence of UTIs and antibiotic resistance susceptibility in patients referred to the non-hospital medical Laboratory in Qazvin province. Most of the epidemiological studies in Qazvin province have been conducted on hospitalized patients, while there has not been a study on the prevalence of UTI in a non-hospital medical Laboratory.
In the current study, the overall prevalence of UTIs was estimated at 9.9%. In the present study, Escherichia coli was the most common causative agent with an abundance of 54.5%, followed by Klebsiella pneumonia at 14.1%. Following Pseudomonas aeruginosa with 1.4% was the least prevalent. These results were in line with the results of the study by Elahe Tajbakhsh and Molood Barzan (19-21). In the present study, 81.2% and 18.7% of UTIs were caused by gram-negative and gram-positive bacteria, respectively, which is consistent with a study conducted in 2020 by Zaha et al. They determined that 84.6% and 38.15% of cases were related to gram-negative and gram-positive bacteria, respectively (22).
With more than 60% effectiveness, Nitrofurantoin, Ciprofloxacin, and Gentamicin were the most effective antibiotics against gram-negative bacteria. Similar to our results, in the other studies most of the isolates were sensitive to Nitrofurantoin, Ciprofloxacin, and Gentamicin (23-26). On the other hand, more than 50% of the isolates were resistant to Nalidixic Acid and Trimethoprim/sulfamethoxazole. In the study conducted by Oladeinde et al., and Shahla Mansouri, Nalidixic acid, sulfamethoxazole-trimethoprim, and amoxicillin had the minimum effect on isolated bacteria (27, 28), which was similar to the results of the current study. Among gram-positive bacteria, 69% of the isolates were sensitive to Amikacin which was in accordance with the results of the study conducted by Mihankhah and Farajnia et al. in the years 2017 and 2007 (29, 30).
Associated genes to antibiotic resistance, the genetic association among the resistant species, and reviewing any relationships with patient characteristics are not defined; these are the limitations of this survey.
This survey would give us a brilliant clue that antibiotic resistances continue to put the world on a path of tremendous future problems, even in treating urinary infections as a common public health problem. As a result, there is a pressing need to persist in a systematic endeavor to train and encourage prescribers of antibiotics to follow evidence-based prescribing to stem antibiotic overuse resulting in antimicrobial resistance.
This work was supported by the Deputy of Research and Technology, Qazvin University of Medical Sciences, Qazvin, Iran. (Grant number: 400000293).
None.
Conflicts of Interest
The authors declared no conflict of interest.
Received: 2022/01/5 | Accepted: 2021/05/18 | ePublished: 2022/08/8
| Rights and permissions | |
 |
This work is licensed under a Creative Commons Attribution-NonCommercial 4.0 International License. |
Copyright Policy
Iranian Journal of Medical Microbiology by Farname is licensed under CC BY-NC 4.0![]()
![]()
![]()
