


![]()
![]()
![]()
BibTeX | RIS | EndNote | Medlars | ProCite | Reference Manager | RefWorks
Send citation to:
URL: http://ijmm.ir/article-1-1452-en.html

 , Adarsh V1 , Ananya Rajagopal1 , Reeta Varyani2 , Prayaag Kini2 , Prakash Kumar2 , Sasmita Sabat3
2- Department of Cardiology, Sri Sathya Sai Institute of Higher Medical Sciences, EPIP Area, Whitefield, Bangalore, Karnataka, India
3- Department of Biotechnology, PES University, Banashankari, Bangalore, Karnataka, India ,
Over the past decade, it has been proved that gut microbiota plays a vital role in human metabolism, immunity, and reactions to diseases. Dynamic elements including diet, age, sex, and ethnicity can affect the gut microbiome (1). Recent research of the gut microbiome has moved towards identifying its relationship with metabolic diseases like coronary artery disease (CAD). Choline, trimethylamine N-oxide (TMAO), and betaine, three metabolic by-products of the bacteria, have been identified to develop risks of CAD. The metabolic pathway linking microbiota metabolism of dietary choline to CAD pathogenesis in humans has been reported elsewhere (2,3). TMAO has been shown to be pro-atherogenic and induce cardiovascular risks (4,5).
The all-important protein for choline-derived TMA formation in the gut is present only in selected bact-eria. Interestingly, the bacteria which harbor this protein are present in small numbers in the gut of a healthy individual. Of these bacteria, the Proteus genus, motile Gram-negative bacterium (6), a known pathogen implicated in Crohn's disease and urinary tract infections (7), has been identified to possess the cutC gene, which encodes for choline TMA lyase. Other pathogenic gut bacterial groups like Klebsiella spp., Clostridium spp., Desulfovibrio spp., and Escherichia coli also possess this cutC gene. It is plausible that these bacteria may exert singular and synergistic dysbiotic effects towards CAD progression. In this study, we set out to evaluate the pathogenic potential of the Proteus genus as a first step to identify key players in the gut microbiome which influence CAD.
Several properties of Proteus point towards its pathogenic potential in the human gut. Firstly, this genus is characterized by its swarming capability; it can transform and produce flagella-assisted motile cells (8), accentuated under anaerobic choline meta-bolism conditions (7-9). Secondly, fimbriae and adhe-sions contribute to adhesion to epithelial surfaces, leading to biofilms (10). Thirdly, the gut of typical healthy human individuals is colonized by various combinations of Proteus vulgaris, Proteus mirabilis, and Proteus penneri, which together comprise less than 0.05% of the entire diverse gut microbiota (11). Fourthly, Proteus bacteria are known to survive in a wide pH range of 2-10, conferring a survival advantage in all the compartments of the GI tract.
Taken together, this strongly suggests that Proteus bacteria is a key member of the dysbiotic state of the gut microbiome. Specifically, it may be inferred that an increase in the proportion of pathogenic gut bacteria (particularly the Proteus genus), when additi-onally compounded by the presence of favorable conditions of pH and metabolites like choline, could contribute to the exacerbation of dysbiosis.
In the current study, we investigated the pathogenic potential of Proteus bacteria in CAD progression, using P. mirabilis and P. vulgaris as two representative organisms. Additionally, we sought to create a predict-tion model to diagnose CAD in an Indian cohort of CAD patients. Through an in silico study on choline TMA lyase in P. vulgaris, a pH range of 7 to 8.5 was identified to be optimal for this protein's functionality. Taking this study of Choline TMA Lyase activity forward, we developed standardized salting out and growth curves to verify an optimal pH for both choline TMA lyase activity and organism growth, respectively. Additionally, we quantified choline and TMAO levels in Indian CAD patients to devise a template for a predictive model for CAD diagnosis.
Sample Collection
Proteus Bacteria
P. mirabilis and P. vulgaris bacterial samples were collected from patients with risks of coronary artery disease at Kempegowda Institute of Medical Sciences (KIMS) Bangalore, India.
CAD Patient Serum Samples
Our study included 20 patients, 14 CAD patients (8 men, 6 women, mean age = 45.07±15.42 years old) and 6 controls (3 men, 3 women, mean age = 40.52±21.82 years old). Inclusion parameters comprised the history of diabetes, obesity, hyper-tension, and smoking. Details of the cohort of the patients have been summarised in Table 2.
Characterization Tests
The characterization of the bacterial samples procured from KIMS was performed by gram staining, catalase test and indole test as described (12). Nutrient agar (HiMedia), nutrient broth (HiMedia) and MacConkey agar (HiMedia) were used for the cultivation of bacteria which was performed at 15psi 121.5°C for 15 min along with an incubation period of 18 h at 37oC.For the study at different pH 2.5, 6.4, 7.4, 8.5 and 9, the medium was adjusted using sterilized 1M HCl and 1M NaOH. The prerequisite for plotting the growth curve was optimizing pH in nutrient broth (NB) (pH 7.4) to 2.5, 6.4, 7.4, 8.5 and 9, using 1M HCl and 1M NaOH, followed by autoclaving it at 15psi, 15 mins & 121.5°C. To prepare the required bacterial suspen-sions for our study, we followed the standard inoculum development procedure: adding a loopful of bacteria to 5ml NB (pH 7.2±0.2) and incubating at 37°C for 18 h. Further, 2.5 mL of the inoculum was added to test tubes, each containing 25 mL of pH optimized NB and stored at 37°C, with gentle shaking at 200 rpm.
The absorbance of the broth culture was measured at 600 nm (OD600) using a UV spectrophotometer (Eppendorf, India) for 8 continuous hours at 1-hour intervals. Growth curves were plotted for both species.
Ammonium Sulphate Precipitation
The partial purification of proteins using extrapure ammonium sulfate precipitation was performed with 1 mL of the incubated (18 h) crude bacterial sample (13). The ammonium sulfate concentration ranged from 30-60%.Dialysis
Partial purification of the protein from the bacterial sample was carried out using a dialysis bag (MWCO 10kDA) (13).Total Protein Quantification by Lowry's Method
Lowry's method estimated the total protein concentration from the 18 hours harvested culture (14). A BSA standard curve was plotted within the range of 0-1000µg/mL.SDS-PAGE
The molecular weight of the partially purified protein was identified by SDS-PAGE (15).Choline Estimation
The choline estimation was performed from patients' serum samples (16). A choline standard curve was plotted within the range of 0-10 µg/mL. This range was chosen after a review of several studies which had measured choline levels in CVD patients and controls (17).Trimethylamine-N-oxide (TMAO) Estimation
The TMAO estimation was performed from patients' serum samples (18). The TMAO standard curve was plotted within the range of 0-10 µM. After reviewing several studies that measured TMAO levels in CVD patients and controls, this range was chosen.FTIR Spectroscopy
The qualitative estimation was performed using FTIR spectroscopy from patients' serum as described (19). The infrared spectra of choline and TMAO (Sigma-Aldrich) were measured using the Perkin Elmer FTIR model 2000 spectrophotometer (PerkinElmer India Pvt Ltd). The absorption and transmittance spectrum was recorded in the wavenumber range from 4000 cm-1 to 400cm-1. OriginPro (version 2019b) was used for data acquisition and handling.Predictive Model
Statistical Analysis
A receiver operator characteristics (ROC) graph was plotted to obtain a cut-off value for a model based on the selected parameters. Next, multivariate logistic regression was performed using R Studio.
Characterization of Proteus Bacteria
Gram Staining
The bacteria were characterized by gram staining. Observation of bacteria from both species under 100X (oil immersion) magnification after the gram staining protocol revealed pink-colored short rod-shaped bacteria, confirming the gram-negative nature of Proteus bacteria.
Catalase Test
A brisk effervescence was observed immediately after the addition of H2O2 to both bacterial species, indicating the presence of catalase.
Indole Test
After adding the Kovac's indole reagent to the incubated test tubes, a red-colored ring and green colored ring were obtained for P. vulgaris and P. mirabilis (and control), respectively. This indicates that P. vulgaris bacteria contain the tryptophanase enzyme while P. mirabilis does not. Additionally, this serves as a distinguishing test between P. vulgaris and P. mirabilis.
The combination of tests mentioned above was sufficient to identify the isolate obtained as Proteus species.
Measurement of Growth Curve
As shown in Figure 1, the turbidimetric growth curves were generated using the ggplot2 package in R Studio (v1.4.1717-3) for each bacterial species based on the changes in the OD (measured at 600 nm) due to bacterial growth over time. It produces a by-subject plot of predicted growth curves with associated data values and an aggregated by-group plot of growth curves, and a smoother line for each group based on user input.
Statistical analysis on the growth curve dataset was performed by calculating the generation time and specific growth rate represented by Td and k, respectively (Figure 2a and 2b).
This growth rate is calculated by identifying the best fit of the log phase of the curve. To produce the best fit curve, the Y-axis of the log phase data was converted into the logarithmic scale. This transforms the exponential growth curve into a straight line. Now, the OD values at the beginning and end of the log phase, X0 and Xt, respectively, were used to calculate the growth rate using the formula
Specific growth rate k = log (Xt) - log(X0)
X0 0.301t.
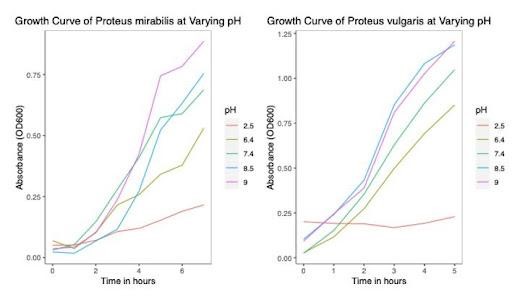
Figure 1. Growth curves of Proteus mirabilis (Left) and Proteus vulgaris (Right) at varying pH.

Figure 2a. Best fit curves of the log phase of the Proteus vulgaris growth curves.
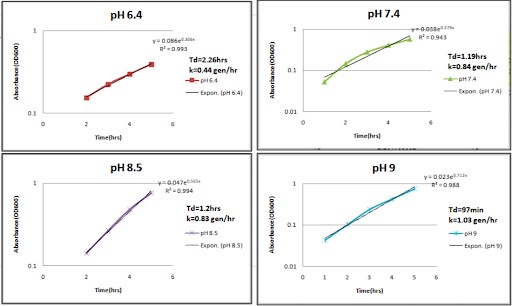
Figure 2b. Best fit curves of the log phase of the Proteus mirabilis growth curves.
Total Protein Estimation by Lowry's Method
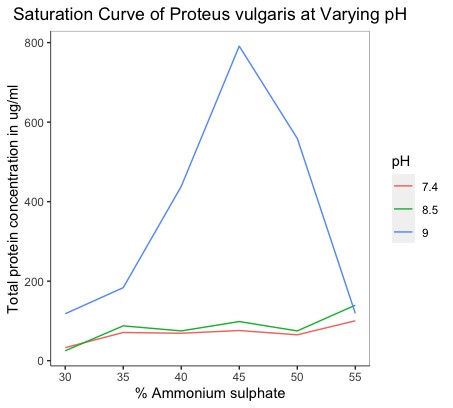
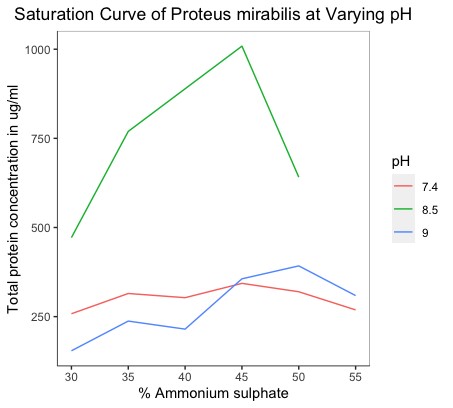
The BSA standard curve was plotted at 660 nm. The unknown protein concentrations extracted and partially purified for each of the salt concentrations at all pH conditions were estimated regarding this standard. Additionally, we plotted graphs that depicted the saturation curves of P. vulgaris and P. mirabilis at varying pH states. The total protein concentrations were plotted against the salt concentrations used for precipitation (Figure 3).
|
|
|
|
Figure 3a. Saturation curves of Proteus vulgaris at varying pH states. |
Figure 3b. Saturation curves of Proteus mirabilis at varying pH states. |
SDS-PAGE
The gel generated by SDS-PAGE to ascertain the presence of protein fractions in each aliquot showed many bands. In particular, multiple bands were observed in the 29 - 97kDa range, and a single band was observed between 97-200kDa (Figure 4). This sole band between 200kDa and 97kDa (present around the 120 kDa mark) in the lanes could be the protein of interest as the molecular weight of choline TMA lyase is ~124kDa (20).
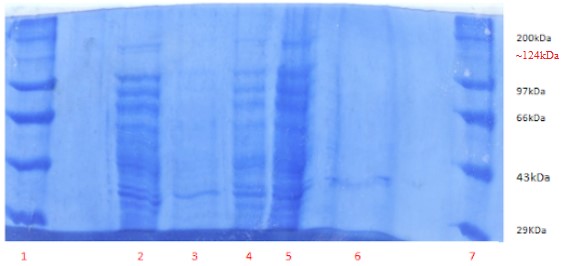
Figure 4. SDS-PAGE of the whole-cell protein. Lane 1: Protein Marker,
Lane 2: Crude 1(3µL), Lane 3: AS+D supernatant (150 µL), Lane 4: AS+D pellet (5µL), Lane 5: AS pellet (5µL), Lane 6: AS supernatant (50 µL), Lane 7: Protein marker.
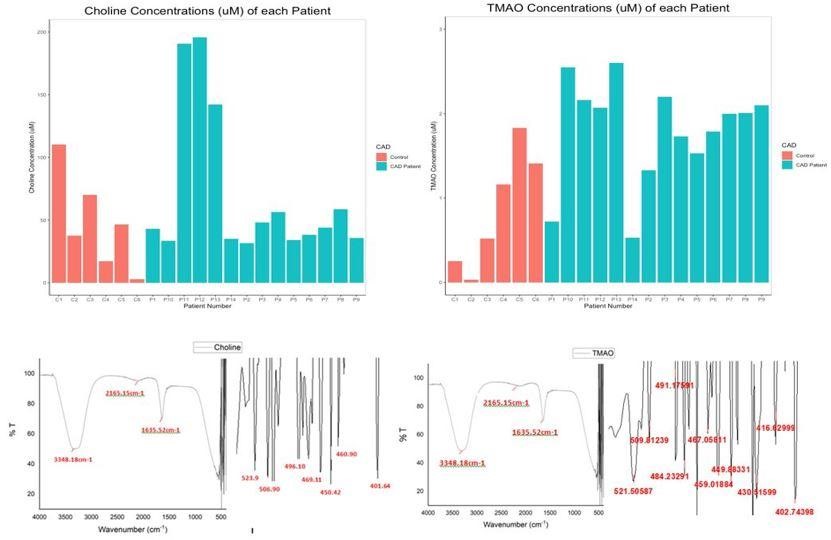
Figure 5. Top Row: Bar Plot Depicting the (a) Choline Concentrations (in µM) (b) TMAO Concentrations (in µM) of Each Individual. Bottom Row: FTIR spectrum depicting wavenumber against transmittance for standard c) choline and d) TMAO.
Choline Estimation
We identified that the choline concentration occurs within a broad range of 25 to 60 µM, in both controls and CVD patients. Using this graph as a reference, the choline concentrations in the serum samples of controls and patients using UV spectrophotometry at 365 nm were measured. Figure 5a summarizes the choline concentrations of all 20 samples analyzed in this study. The average choline concentrations in controls and CAD patients were 47.34 µM (46.35 - 48.32 µM) and 70.37 µM (69.38 - 71.36 µM), respectively, with a confidence interval of 95%.
TMAO Estimation
Figure 5b summarizes the TMAO concentrations of all 20 samples analyzed in this study. The average TMAO concentrations in controls and CAD patients are 0.86 µM (0.85 - 0.88µM) and 1.81 µM (1.79 - 1.82 µM) respectively.
FTIR Spectroscopy
The spectra of choline and TMAO have a very strong and broad band at 3348.18 cm-1, a weak peak at 2165.15 cm-1 and a sharp peak at 1635.52 cm-1, as shown in Figures 5c and 5d. These bands characterize the functional groups present in both compounds. The distinguishing feature between the spectra of both these compounds lies within the fingerprint region of 500 to 400cm-1.
Predictive Model
According to our spectrophotometric analysis, plasma choline and TMAO levels were significantly altered in control/CAD patients. We intended to determine the potential utility of circulating TMAO levels as a diagnostic biomarker of CAD. Hence, ROC analysis was performed to evaluate the predictive power considering the age, sex, and history of diabetes, serum choline, and TMAO concentrations as contributing parameters to CAD. The obtained ROC graph (Figure 6) has an area under the curve (AUC) = 0.893.
Table 1. Patient Clinical History
| Patient Number | Presence of CAD | Choline Concentration in µM | TMAO Concentration in µM | Significant History |
|---|---|---|---|---|
| P1 | CAD | 42.81313632 | 0.721847931 | Diabetes, smoking |
| P2 | CAD | 31.32668511 | 1.328200192 | Akinetic |
| P3 | CAD | 48.03425051 | 2.204042348 | - |
| P4 | CAD | 56.38803321 | 1.732435034 | - |
| P5 | CAD | 33.93724221 | 1.530317613 | Surgery |
| P6 | CAD | 38.11413356 | 1.790182868 | High BP |
| P7 | CAD | 43.85735916 | 2.001924928 | - |
| P8 | CAD | 58.47647888 | 2.011549567 | Heavy smoker, FBS, hypokinetic myocardium |
| P9 | CAD | 35.50357646 | 2.098171319 | Rheumatoid, akinetic |
| P10 | CAD | 33.41513079 | 2.550529355 | High BP, Hypertension,diabetes |
| P11 | CAD | 190.5706678 | 2.155919153 | Stent, high BP, diabetes, Overweight |
| P12 | CAD | 195.791782 | 2.069297401 | 6 stents, High BP, diabetes |
| P13 | CAD | 142.0143059 | 2.598652551 | Smoker, osteoarthritis |
| P14 | CAD | 34.98146504 | 0.529355149 | High BP, stent |
| C1 | No CAD | 110.1655093 | 0.250240616 | - |
| C2 | No CAD | 37.59202214 | 0.028873917 | - |
| C3 | No CAD | 69.96293009 | 0.51973051 | Arteriosus |
| C4 | No CAD | 17.22967681 | 1.164581328 | Neurological condition |
| C5 | No CAD | 46.46791625 | 1.828681424 | Diabetes |
| C6 | No CAD | 2.610557093 | 1.405197305 | Diabetes, smoking |

Figure 6. Receiver Operator Characteristics Graph
We formed a multivariate regression model to calcul-ate the odds of having CAD using these parameters. The results are summarized in Table 2.
Table 2. Results of Multivariate Logistic Regression in R.
| Coefficients | Estimate | Std. Error | Z value | Pr ( > Z ) |
| (Intercept) | -4.85989 | 3.53618 | -1.374 | 0.1693 |
| TMAO concentration | 2.80055 | 1.40663 | 1.991 | 0.0465 |
| Age | 0.01232 | 0.03557 | 0.346 | 0.7291 |
| Sex | 1.69448 | 1.74369 | 0.972 | 0.3312 |
| Diabetes | -1.91948 | 1.65473 | -1.160 | 0.2461 |
| Choline concentration | 0.02248 | 0.02508 | 0.896 | 0.3701 |
TMAO concentration was identified to be a significant and powerful predictor for CAD diagnosis, as evidenced by its low p-value (P<0.05). Hence, we considered these parameters to form a preliminary multivariate logistic regression equation.
f(x) = -4.859 + 2.8*(TMAO Concentration) + 0.012*(Age) + 1.69*(Male) - 1.919*(Diabetes) + 0.02*(Choline Concentration)
Where f(x) is the log (odds of having CAD).
To calculate P, the odds of having CAD, we use the formula:
P = exp(f(x)) / (1 + exp(f(x))
If P >= cut-off = 0.795, then the person can be considered as a CAD patient.
Although there is enough evidence of the contribution of gut-derived metabolite TMAO in the progression of cardiometabolic disorders, studies characterizing gut bacteria responsible for the production of TMAO in CAD patients are lacking. Growth rate becomes an essential factor to consider while trying to identify the effect of a particular environmental condition on bacterial growth (8). In particular, a higher growth rate implies faster bacterial growth and generation time. The influence of incubation time for the completion of each growth cycle was determined to be between 22 and 24 hours. For P. vulgaris, we observe the highest growth rate at the 8.5 pH state, followed by 9, 7.4, and 6.4, respectively. For P. mirabilis, we observe the highest growth rate at the 7.4 pH state, followed by 8.5, 9, and 6.4, respectively. Correlating these pH states to that found within the different compartments of the GI tract of the human body, we may infer that the local micro-environment conditions of the intestines, with their neutral to alkaline pH, optimally support the growth of P. vulgaris and P. mirabilis. From the saturation curves, it was observed that at pH 9 in P. vulgaris, 45% of salt concentration gives the highest protein yield. At pH 8.5 in P. mirabilis, 45% of salt concentration gives the highest yield of protein. Of salt concentration, 45% can be taken as the optimal concentration for the organism and pH state, respectively.
The present study is the first of its kind in that it provides new information about the relation between plasma levels of TMAO and CAD in Indian patients. Other investigative studies have reported the median choline and TMAO concentrations in CAD patients to be 41.1 µM and 3.7 µM, respectively (21). We hypothesize that this difference could be due to considering a different cohort. Therefore factors like diet, lifestyle, and health conditions can contribute to the observed differences in serum choline levels.
Table 1 summarises the clinical histories of the patients included in this study. Our serum metabolite quantification results correlate with the patients' clinical histories. P9 has a history of rheumatoid arthritis (RA). According to our observations, this patient has low choline and high TMAO levels in her serum. Low serum choline levels are associated with RA due to higher uptake and metabolism by the inflamed tissues (21). Therefore, in addition to higher consumption by the gut bacteria, this clinical history could also account for the decrease in circulating free choline in the patient.
Furthermore, RA and CVDs have been found to be interrelated by the associated inflammation (which is a characteristic of RA) (22). This inflammation leads to stress, which activates the inflammasome, ultimately promoting the formation of atherosclerotic lesions. TMAO, a metabolite associated with promoting these inflammation factors, is present in high concent-rations in such conditions. This could be an explana-tion for the high serum TMAO concentration detected. P11 and P12 both have histories of type II diabetes and stent usage. These patients demonstrate high choline and TMAO concentrations in their serum. High serum choline concentrations have been found to be associated with increased T2DM risk (23). The association between high TMAO levels and T2DM patients has also been well documented (24, 25). Our results fall in line with these findings. P13 has a history of osteoarthritis. Some studies have identified risk factors such as aging, obesity, and chronic inflamm-ation being common between CVD and osteoarthritis (26). Thus, high choline levels could be derived from sources other than the diet, for example, mechanisms like platelet rupture and increased leukocyte–PLD activity in inflammation, to name a few (27). TMAO has been identified as a potential player in the inflammatory phenotype associated with arthritis (28). This could support the high TMAO concentration in this patient's serum.
Additionally, our study demanded a test to allow the qualitative analysis of the metabolites. To meet this purpose, Trotter et al.'s (2016) study used FTIR spect-roscopy to analyze the functional groups of compounds. On applying the same technique, we arrive at the spectra of choline and TMAO that show a very strong and broad band at 3348.18 cm-1, which is assigned to -OH stretching vibration. The shape of the band most likely indicates the presence of intramolecular hydrogen bonds since choline posse-sses both hydrogen bonding donors and acceptors. The weak peak at 2165.15 cm-1 confirms the presence of hydrogen bonds (29), and the sharp peak at 1635.52 cm-1 corresponds to the deformation vibration of NH3+. These bands characterize the functional groups present in both compounds. On comparing the spectral results of the serum samples with that of the standards, we see that the bands are similar to that obtained in the standard spectra. Therefore, it can be concluded that the test confirms the presence of choline and TMAO in the serum samples.
Several studies have focused on statistical analysis to determine the utility of modifiable risk factors to improve the clinical prognosis of CAD progression. Here, we aimed to develop a preliminary predictive model for CAD diagnosis using 5 known risk factors amongst a sample size of 20 individuals. This model can be considered as a building block, which, when expanded to include larger sample sizes, categories, and statistical analyses, becomes an accurate and practical CAD diagnostic tool for medical practitioners.
ROC analysis and the subsequent logistic regression model revealed circulating TMAO levels' predictive power in our study. We observe that the ROC graph is skewed towards the true positive rate. Taken toge-ther, this indicates that the selected parameters of age, sex, history of diabetes, choline, and TMAO serum concentrations are good predictors of CAD. The cut-off value was selected as 0.795. This is the value where the true positive rate is high along with a significantly low false positive rate, which is a desirable characteristic of a diagnostic equation or tool. Multivariate logistic regression analysis further revealed the strong association of TMAO expression with CAD. While our model does not indicate any other parameters to be significant, possibly due to the small sample size, it has already been well documented in the literature that age, diet, sex, and history of diabetes are essential contributors to the development and progression of CAD (24, 30, 31, 32). In fact, evidence produced by several scholars across the globe has stressed the need to practice a well-tested healthy dietary pattern. This pattern empha-sizes plant protein sources and reduced animal fat intakes to reduce CVD. An Asian diet with the lowest meat intake and highest legume consumption puts Indians in the low-risk category for developing comorbidities.
In all, further research on the gut microbiome as an ecosystem is necessary towards understanding the Proteus species in terms of its role in disease and interactions with other gut microbes. This data could help identify the risks imparted by the gut microbiota in CAD and help devise appropriate medications. For example, identifying gut microbiota targeting antibio-tics and Choline TMA Lyase inhibitors as CAD thera-peutics could be an exciting study area.
Choline TMA Lyase functionality is optimal at the neutral and alkaline pH range, as found in the small and large intestines. Our findings demonstrate the optimum bacterial growth for P. mirabilis and P. vulgaris within the same range of 7.4-9.0. Taken together, these results point towards the strong pathological potential of Proteus bacteria in the progression of CAD. This introduces Proteus bacteria as a new potential therapeutic target for CAD. The results of quantitative estimation by spectrophoto-metry identified TMAO to be a significant and powerful predictor for CAD in Indian patients. While the general trend observed was that CAD patients had low serum choline and high serum TMAO concent-rations, patients with significant clinical conditions like diabetes and arthritis had high serum choline and TMAO concentrations. Finally, the proposed predi-ctive model template, once improved upon by taking a larger sample size and expanding the parameters to include detailed categories, could serve as a useful tool for the progressive assessment of the risk factors for CAD by medical practitioners.
We would like to thank Dr. Shekhar Rao, Director, Sri Sathya Sai Institute of Higher Medical studies and Hospital, Whitefield, Bangalore, for providing us with patient’s sample. Dr. Anjana Gopi, Head of the department of Microbiology, KIIMS, Bangalore, for providing us with microbial cultures .
None.
Conflicts of Interest
The authors declare any conflict of interest.
Received: 2021/08/26 | Accepted: 2022/01/30 | ePublished: 2022/03/20
| Rights and permissions | |
 |
This work is licensed under a Creative Commons Attribution-NonCommercial 4.0 International License. |
Copyright Policy
Iranian Journal of Medical Microbiology by Farname is licensed under CC BY-NC 4.0![]()
![]()
![]()
