


![]()
![]()
![]()
BibTeX | RIS | EndNote | Medlars | ProCite | Reference Manager | RefWorks
Send citation to:
URL: http://ijmm.ir/article-1-1392-en.html


2- Department of Statistics, Ferdowsi University of Mashhad, Mashhad, Iran
3- Department of Statistics, Ferdowsi University of Mashhad, Mashhad, Iran ,
The novel coronavirus called SARS-CoV-2 was initially observed in Wuhan, China, in December 2019, and then it spread rapidly throughout the world and affected an enormous number of people (1-5). Because of its high contagiousness, particularly dynamic structure, unknown etiology, and hazard-ousness, the virus has raised great concern for the governments and public health officials (2, 6-8).
Some transmission routes are close personal contact (6) and respiratory droplets, when the infected person sneezes, coughs or even speaks (9, 10). The mortality rate in the elderly and high-risk groups such as those with cardiovascular diseases, diabetes, chronic respiratory disease, and hypert-ension is significantly higher than in the healthy ones (11). Being aware of the spread of COVID-19 can help governments and decision-makers make the right decisions and perform effective plans to prevent its spread (6, 7, 12). It is worth noting that the most critical factor in controlling and reducing the spread of the virus is its recognition, health care, and control measures (13). Also, to prevent the spread of disease and reduce subsequent morbidity and mortality, predicting of virus' future behavior is necessary (6, 7).
Generally, a further wave of infection occurs following a reduction in the number of confirmed cases. This upcoming wave could also spread world-wide with even more severe effects on people's health. So, restrictions imposed by governments must be re-enforced to reduce the incidence and control the spread, as in the first wave of disease (14).
Several SARS-CoV-2 variants have emerged since December 2020, including the Alpha, Beta, Gamma, and Delta in April 2021, respectively. These variants were discovered for the first time in the United Kingdom, South Africa, Brazil, and India, respectively. Another new mutation of the SARS-CovV-2 was recently named and classified as Lambda on June 14, 2021, by the WHO organization. This variant was detected in more than 20 countries, including South American countries, particularly Chile, Peru, Ecuador, and Argentina. The nature of this new type of virus mutation is entirely unknown (15).
The US Food and Drug Administration approved some vaccines (15). After making several somewhat effective vaccines, another serious concern has arisen. It seems that after the first dose, the COVID-19 vaccines had less effectiveness against the delta variant. It was observed that two weeks after injecting the second dose of the vaccines, the Pfizer-BioNTech and Oxford-AstraZeneca, showed an effect of 88% and 60% against the delta type, respectively. However, three weeks after injecting the first dose, the two vaccines showed an impact of 33% (16). The results of a study by Acevedo et al. showed that lambda-type mutations increased infection and escaped from neutralizing antibodies elicited by the vaccine of inactivated virus (15). Thus, the behavior and nature of this virus are not yet fully understood. Also, the immune system's response has not yet been precisely elucidated.
The current situation shows that the prevalence of this disease has not only not decreased, but the condition of the disease has not stabilized. Therefore, helpful strategies such as forecasting the behavior of the virus can be valuable in preventing its spread. Forecasting the virus's behavior and prevalence in the fourth or even subsequent waves is of major impor-tance (14). Not only forecasting the structure, rate of the pandemic, and the virus's future behavior is very useful in defining an effective and appropriate measures framework for governments (9), but also it is helpful in implementing timely interventions to prevent outbreaks (7, 9).
In this study, we intend to reveal SARS-CoV-2 behavioral patterns using cluster analysis in countries worldwide. Then, to use the XGBoost family of models to forecast and identify the future behavior of SARS-CoV-2 for the next 20 days in Iran.
2.1. The Dataset
The main dataset used in this study is COVID-19 epidemic data. These data were reported daily around the world. We used three groups of these time series data: the cumulative number of confirmed, death, and recovered cases per day reported from February 20 to July 03, 2021, on the "worldometers" website (https://www.worldometers.info/coronavirus/).
We received the total number of confirmed, death, and recovered cases and the population of each country, for all countries, on July 03. The cluster analysis includes countries with data as of July 03. All analyses in this study were performed using R software version 4.0.2.
2.2. Cluster Analysis
Cluster analysis is a widely used and popular method in machine learning (17). This unsupervised learning method is a process that the group's data are called clusters (18). In this method, the grouping is such that, firstly, the objects within each cluster have the highest similarity compared to other clusters. Secondly, each cluster is different from the other cluster. Cluster analysis works based on the Euclidean distance similarity measure. There are other similarity measures, but the Euclidean distance is usually preferred (18, 19).
There are two types of clustering algorithms: partitioning and hierarchical. In partitioning clust-ering, the data is divided into k groups, and k is the number of groups that must have been previously determined by the analyst (19). The partitioning clustering includes several methods, such as k-means (18). Hierarchical clustering is another data clustering method that does not require pre-determining the number of clusters. The hierarchical analysis includes two approaches: Agglomerative and Divisive.
In the Agglomerative approach, which is a down-top clustering method, each observation is first considered as a cluster. Then in each iteration of the algorithm, similar clusters are merged, and the proximity matrix is recalculated until all clusters are merged to form a single cluster (17, 19). The results of the hierarchical analysis can be visualized by a graph called a Dendrogram. The Dendrogram is a tree-like diagram that shows the cluster merging sequence. In this diagram, by cutting the Dendrogram at the desired similarity level, the observations in the dataset can be divided into groups (17, 19).
Divisive clustering is a top-down clustering method and the exact opposite of Agglomerative clustering. In this type of method, first, all the observations form a cluster, and then, considering the dissimilarity, the clusters are divided into smaller clusters. This process proceeds recursively on each cluster until only one observation in each cluster would exist (18).
2.3. Auto-Regressive Integrated Moving Average Model (ARIMA)
ARIMA models are known as Box-Jenkins models, which are non-stationary time series (20). These models are well-known and widely used to forecast time series problems (20). The sequences depend on their past values in time series, which can forecast future time series values (20, 21). The auto-regressive (AR), moving average (MA), and white noise process models are integrated to form ARIMA models.
A time series follows the auto regressive-moving average (ARMA) model as follows:

where p, q, and refer to the order of auto-regressive part (AR), the order of moving average part (MA), and white noise process models, respectively (22).
Time series models are transformed to ARIMA (p, d, q), time series model by taking differences (from d order) and also adding ARMA (p, q) model (20).
Therefore, the auto-regressive integrated moving average (ARIMA) models are generalized ARIMA models, which is expressed as follows:

where, p indicates orders of auto-regression, q is the order of moving average, and d is the number of differencing times. It should be noted that when d is equal to zero, then the ARIMA model reduces to ARMA model (22).
2.4. Exponential Smoothing (ETS)
Exponential smoothing models were developed in the 1950s, which are the most popular forecasting methods. These models are the basis of some of the most successful forecasting models in use today. In exponential smoothing models, the weights decrease exponentially for past observations (23). These models can take into account trend (T), seasonal (S), and irregular or error (E) components in forecasting (20). There are two ETS models, additive and multiplicative models which depend on the seasonal component (24).
2.5. Automatic Forecasting Procedure (Prophet)
A prophet model is a forecasting tool that is available and developed by Facebook (25). This model is used for business tasks on Facebook and has been optimized for this purpose (12). This model is an additive regression time-series forecasting algorithm. Prophet considers a trend, seasonality, and holiday components (12, 25). The seasonality effect is considered based on the Fourier series, which is a more flexible model for periodic effects (12).
2.6. Naive
Naive is a model for forecasting future values of time series. This model does not use past values of observations and previous knowledge in the data to forecast. In other words, the forecasted value equals the last observed value in this model. This model is a benchmark for comparisons and works remarkably well for many economic and financial time series (26, 27). The naive model is the best forecasting model for stock market prices and indexes (26).
2.7. Seasonal Naive (s-Naive)
Seasonal Naive is a simple and useful model for seasonal data. Each forecast is equal to the last observed value from the same season of the year. The naive and seasonal Naive models do not include any parameters in forecasting work. Therefore, these models' fitted values are true forecasts (26).
2.8. Boosted ARIMA
Extreme Gradient Boosting (XGBoost) machine learning method is used in various fields, such as machine learning and data mining analysis by many data analysts. The boosting methods are used to form the tree ensemble model, i.e., a set of CART models (28). A CART model does not have a strong predictive power. In real applications, it usually employs ense-mble methods that have better predictive power than the CART models, and prediction is obtained based on averaging training from several CART models. Gradient boosting is an approach that produces a new model that calculates the final prediction based on the sum of the predicted errors of previous models (28). So, boosted ARIMA model uses boosting to improve residuals of the model and thus, creates a special mode of time series models (29).
2.9. Boosted Prophet
The boosted prophet model, a new hybrid model, combines the prophet with the XGBoost method. This model also improves residuals and creates a particular mode of time series models (29).
2.10. Model Evaluation
Finally, the Root Mean Square Error (RMSE), Mean Absolute Error (MAE), and Mean Absolute Percentage Error (MAPE) performance metrics were used to evaluate the forecasting precision of models in the testing phases. The actual values and predicted values of the time series are indicated by the symbols and at the ith time, respectively (24). The formula of these metrics are defined as follows:

In this section, we describe the results of our study in more detail. We first plotted the absolute number of confirmed, death, and recovered cases from the onset of the pandemic (February 20, 2020) to July 03, 2021, to find out the general situation of the pandemic during this period. This diagram is shown in Figure 1. According to the trend of the absolute number of confirmed cases, it was found that there are four peaks in Iran, the first peak occurred on the 40th day, and the second peak, which is larger than the first peak, occurred on the 106th day. We observed a slight increase after the 107th day and then a larger peak on November 27 (282nd day) with 14051 absolute confirmed cases. After that, the biggest peak occurred on the 432nd day (April 26, 2021), with 21026 confirmed cases.

Figure 1. The trends of daily confirmed deaths and recovered cases in Iran.
-
The results of part 1
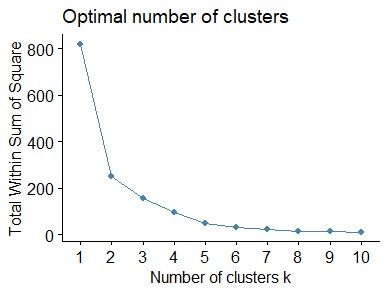
We used hierarchical cluster analysis and removed countries whose information was not available. As a result, 206 countries remained, and then these countries were clustered. The optimal number of clusters was determined by the most commonly used approaches, namely Elbow, Silhouette ([See Figures 2 (a) and (b)]). These plots showed that two clusters were enough; however, we considered six clusters for better differentiation. The resulting Dendrogram is shown in Figure 3, and the clustering of 206 countries into six clusters is reported in Table 1.
 |
 |
| Figure 2. (a) Elbow method | Figure 2. (b) Silhouette method |
For the cluster validation, the Multivariate Analysis Of Variance (MANOVA) test was performed, which showed that this clustering is statistically significant (P<0.001). The clustering results show that the USA falls in the first cluster, India in the second cluster, and Brazil in the third cluster. The behavior of coronavirus in Iran was more similar to the countries such as France, Russia, Turkey, the UK, Argentina, Colombia, Italy, Spain, Germany, Poland, Mexico, and Indonesia. These countries fall in the fourth cluster. China falls in the last cluster (sixth cluster). Other countries were in the fifth cluster (Table 1).
Therefore, it can be stated that the SARS-CoV-2 had similar behavior patterns in each cluster. The centers of clusters are shown in Table 1. According to cluster centers, the highest number of infections and deaths were in the first cluster, the highest number of recovered cases were in the second cluster. Hence, the minimum number of confirms, deaths, and recovered cases were in the fourth cluster. Thus, the fourth cluster had a better situation regarding the number of infections and deaths cases compared to other clusters.

Figure 3. The Dendrogram of hierarchical clustering.
Table 1. The results of hierarchical clustering.
| Cluster | Countries | |||||
|---|---|---|---|---|---|---|
| 1 | USA | |||||
| [34588176.0, 621255.000, 29087421.0, 332950223]* | ||||||
| 2 | India | |||||
| [30545433.0, 402015.000, 29658078.0, 1393605337]* | ||||||
| 3 | Brazil | |||||
| [18742025.0, 523699.000, 17033808.0, 214075074]* | ||||||
| 4 | France | Russia | Turkey | UK | Argentina | Colombia |
| Italy | Spain | Germany | Iran | Poland | Mexico | |
| Indonesia | ||||||
| [3838265.5, 99855.200, 3550986.1, 85750656]* | ||||||
| 5 | Ukraine | South Africa | Netherlands | Czechia | Chile | Philippines |
| Canada | Iraq | Sweden | Belgium | Romania | Pakistan | |
| Bangladesh | Portugal | Israel | Hungary | Japan | Malaysia | |
| Jordan | Serbia | Switzerland | Austria | Nepal | UAE | |
| Lebanon | Morocco | Saudi Arabia | Ecuador | Bolivia | Tunisia | |
| Kazakhstan | Paraguay | Greece | Bulgaria | Belarus | Panama | |
| Slovakia | Uruguay | Costa Rica | Georgia | Kuwait | Croatia | |
| Azerbaijan | Dominican Republic | Palestine | Guatemala | Denmark | Thailand | |
| Egypt | Lithuania | Venezuela | Ethiopia | Ireland | Oman | |
| Honduras | Bahrain | Sri Lanka | Slovenia | Moldova | Armenia | |
| Qatar | Bosnia and Herzegovina | Cuba | Libya | Kenya | Nigeria | |
| Myanmar | Zambia | S. Korea | North Macedonia | Algeria | Latvia | |
| Albania | Norway | Estonia | Kyrgyzstan | Mongolia | Afghanistan | |
| Uzbekistan | Montenegro | Finland | Ghana | Namibia | Uganda | |
| Cameroon | El Salvador | Mozambique | Cyprus | Maldives | Botswana | |
| Luxembourg | Singapore | Cambodia | Zimbabwe | Jamaica | Ivory Coast | |
| Senegal | Madagascar | DRC | Rwanda | Angola | Malawi | |
| Sudan | Trinidad and Tobago | Cabo Verde | Australia | Malta | Ré:union: | |
| French Guiana | Syria | Gabon | Guinea | Suriname | Mauritania | |
| Guyana | Mayotte | Vietnam | Eswatini | French Polynesia | Haiti | |
| Papua New Guinea | Guadeloupe | Seychelles | Taiwan | Somalia | Mali | |
| Togo | Andorra | Tajikistan | Burkina Faso | Belize | Bahamas | |
| Congo | Martinique | Curaçao | Hong Kong | Djibouti | Lesotho | |
| Aruba | South Sudan | Timor-Leste | Equatorial Guinea | Benin | Nicaragua | |
| CAR | Yemen | Iceland | Fiji | Gambia | Eritrea | |
| Sierra Leone | Niger | Burundi | Saint Lucia | San Marino | Chad | |
| Liberia | Channel Islands | Gibraltar | Barbados | Comoros | Guinea-Bissau | |
| Liechtenstein | New Zealand | Sint Maarten | Monaco | Bermuda | Turks and Caicos | |
| Sao Tome and Principe | Saint Martin | Laos | St. Vincent Grenadines | Bhutan | Mauritius | |
| Caribbean Netherlands | Isle of Man | Antigua and Barbuda | St. Barth | Faeroe Islands | Cayman Islands | |
| Tanzania | Saint Kitts and Nevis | Wallis and Futuna | British Virgin Islands | Brunei | Grenada | |
| Montserrat | Western Sahara | Vanuatu | ||||
| [217366.6, 3984.144, 202032.4, 16755433]* | ||||||
| 6 | China | |||||
| [91847.0, 4636.000, 86783.0, 1439323776]* | ||||||
* Cluster centers were reported as [confirmed, death, recovered, population]
-
The results of part 2
The results of fitting different forecasting models are demonstrated in the second part of this study. The ARIMA, ETS, Prophet, Naive, s-Naive, ARIMA XGBoost Error, and Prophet XGBoost models were used to fit the training data.
During the construction of the models, the ARIMA (1, 0, 0) (0, 1, 2) [7], ARIMA (1, 1, 2) (1, 0, 1) [7], ARIMA (0, 1, 3) (1, 0, 1) [7] were detected as the best model (were obtained as automatically with the "modeltime" package) for the confirmed, death and recovered cases, respectively. The XGBoost is a way to generate a specification of a time series model that uses boosting to improve modeling errors or residuals on exogenous regressors. In the current study, the combination of ARIMA and XGBoost/ Prophet and XGBoost was applied. In XGBoost models, the optimal values of hyper-parameters such as the depth of the tree, the number of trees, learning rate, and the minimum number of data points in a node required for a node to be split further were determined by trial and error.
After training and constructing all the final models on the training dataset, the models were evaluated on the test dataset.
The model's performance metrics are shown in Table 2. Based on Table 2, the XGBoost-oriented models had less forecasting error (or more accuracy) on the test dataset than other models. Therefore, these models were selected for the 20-day forecasting horizon.
Table 2. Accuracy table on the test phase.
| Model | Confirmed Cases | Death Cases | Recovered cases | ||||||
| RMSE | MAE | MAPE | RMSE | MAE | MAPE | RMSE | MAE | MAPE | |
| ARIMA | 4887.39 | 4454.05 | 41.02 | 166.11 | 124.81 | 44.25 | 7680.37 | 6969.41 | 48.47 |
| ARIMA XGBoost Error | 4220.05 | 3939.92 | 36.36 | 156.30 | 113.76 | 39.32 | 7437.18 | 6700.47 | 46.33 |
| ETS | 2677.85 | 2349.56 | 21.23 | 162.46 | 120.19 | 41.84 | 7628.96 | 6935.21 | 48.32 |
| Prophet | 4858.09 | 4547.85 | 47.98 | 335.01 | 318.24 | 155.54 | 9304.42 | 8595.42 | 60.61 |
| Naive | 2716.39 | 2368.28 | 21.38 | 169.26 | 129.63 | 47.07 | 7183.15 | 6450.79 | 44.52 |
| s-Naive | 3739.71 | 2884.96 | 26.60 | 180.54 | 142.49 | 53.69 | 7160.68 | 6397.17 | 44.06 |
| Prophet XGBoost Error | 1485.65 | 1074.22 | 10.22 | 342.54 | 316.70 | 151.01 | 6170.92 | 5232.00 | 34.93 |
The 20-day forecasting horizon of the number of confirmed deaths and recovered cases were plotted in Figures 4 (a)-(c). The forecasted values are reported in Table 3.
|
|
|
|
Figure 4. (a) 20-day forecast horizon of the number of confirmed cases by prophet XGBoost Error model with 95% confidence intervals |
Figure 4. (b) 20-day forecast horizon of the number of death cases by ARIMA XGBoost Error model with 95% confidence intervals |
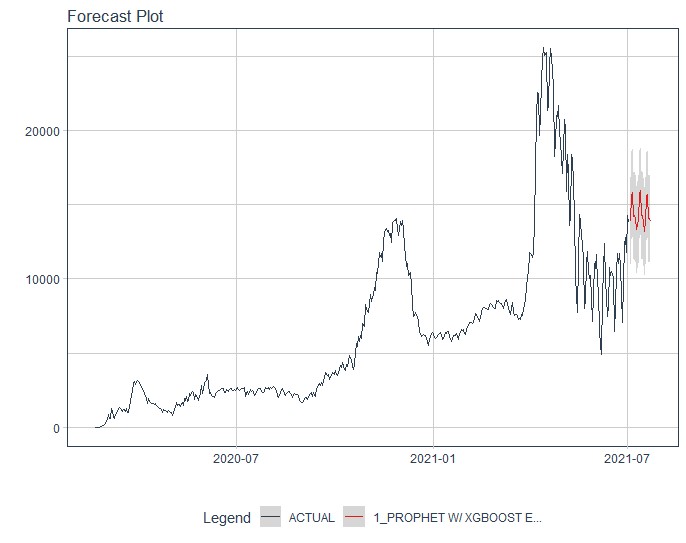


Figure 4. (c) 20-day forecast horizon of the number of death cases by prophet XGBoost Error model with 95% confidence intervals
Table 3. 20-day forecast horizon of confirmed deaths and recovered cases in details
| Date | Confirmed cases by prophet XGBoost Error | Death cases by ARIMA XGBoost Error | Recovered cases by prophet XGBoost Error |
|---|---|---|---|
| 2021-07-04 | 13880 | 178 | 13382 |
| 2021-07-05 | 15621 | 178 | 13321 |
| 2021-07-06 | 15828 | 177 | 13518 |
| 2021-07-07 | 14218 | 173 | 13771 |
| 2021-07-08 | 14270 | 175 | 14038 |
| 2021-07-09 | 14087 | 168 | 13510 |
| 2021-07-10 | 13306 | 175 | 13886 |
| 2021-07-11 | 14010 | 180 | 13878 |
| 2021-07-12 | 15689 | 181 | 13794 |
| 2021-07-13 | 15931 | 180 | 13925 |
| 2021-07-14 | 14275 | 177 | 14129 |
| 2021-07-15 | 14291 | 178 | 14375 |
| 2021-07-16 | 13870 | 173 | 13766 |
| 2021-07-17 | 13194 | 178 | 14080 |
| 2021-07-18 | 13890 | 183 | 14010 |
| 2021-07-19 | 15541 | 183 | 13865 |
| 2021-07-20 | 15701 | 182 | 13937 |
| 2021-07-21 | 14052 | 179 | 14084 |
| 2021-07-22 | 14101 | 181 | 14278 |
| 2021-07-23 | 13833 | 176 | 13621 |
In Iran, after implementing strict restrictions such as social distancing, quarantine, closure of public places, etc., from April to May 2021, the severity of the disease decreased.
Unfortunately, because of the misconception about the destruction of the virus, as mentioned earlier, people reduced the implementation of necessary precautions did not follow health protocols, which led to a re-emergence of the disease periodically in Iran (14).
Currently, it is not possible to stop social and economic activities. Thus, maintaining social distance and conscious self-care is one of the most important measures to prevent coronavirus spread.
Despite repeated warnings from health officials, some people don't keep in mind that they may act as carriers or be infected, and few people follow health protocols and social distancing. This situation has caused an increase in the number of people infected with the coronavirus. In addition, the emergence of newer and more mutated strains of the virus, such as the Delta variant, has led to a more severe increase in the number of people infected.
Abdullah et al. applied k-means clustering to classify provinces in Indonesia. They grouped provinces based on coronavirus disease 2019 data, i.e., confirmed, recovered, and death cases, into three clusters (30). In our clustering, Indonesia falls in the fourth group, similar to the countries such as France, Russia, Turkey, UK, Argentina, Colombia, Italy, Spain, Germany, Poland, and Mexico.
Advance time series such as boosted models for improving prediction errors of models and a popular method in high dimensional were used in this study. The finding of this study indicated family of XGBoost error models, including the ARIMA XGBoost and Prophet XGBoost error model, had better fitting (less forecasting error) than other models, even the ARIMA model for confirmed, death, and recovered cases.
In our previous research, the Holt-Winter and MLP models were identified as appropriate for forecasting the number of confirmed and death cases in future days, respectively. Forecasting results showed an increasing trend for infected cases of COVID-19 and increasing-decreasing trends for death in the next 20 days in Iran (31).
Some previous studies have shown the ARIMA model as the best one for modeling COVID-19 in Iran and other countries. In addition, some other earlier research has concluded that machine-learning models outperformed classical models such as the ARIMA. The more detailed results of these studies are as follows:
Yadav et al. applied the Support Vector Regression (SVR) model to forecast the future number of total cases, active and recovered cases. They compared the proposed method results with other well-known regression models such as simple linear regression and Polynomial regression (32). In another study, Roy et al. used ARIMA to predict the spread of the coronavirus in Indian states, either (33). Ahmadi et al. predicted the number of patients of COVID-19 data by von Bertalanffy, Gompertz, and least squared error on April 3, 2020 (34).
Yang et al. (2020) used the ARIMA models to forecast the numbers of new cases and deaths in Italy (35). Farooq and Bazaz applied Artificial Neural Network (ANN) with an online incremental learning technique in the five worst-affected states of India. They forecasted the future behavior of COVID-19 disease for 30 next days (36).
Christie et al. compared three forecasting methods: ARIMA, single exponential smoothing, and double exponential smoothing. By using the MAPE, RMSE, and MAD measures, they showed that the ARIMA is the best model for forecasting COVID-19 disease (37).
Rostami-Tabar and Rendon-Sanchez used a simple Multiple linear regression model optimized by using calls received in a call center (phone call data) and fitted the ARIMA, ETS, Seasonal Naive, Prophet, and a regression model without call data. They concluded that the simple multiple linear regression model with call data performed better than other models (38).
Moftakhar et al. used two ANN and ARIMA models to forecast the number of future cases in the next 30 days in Iran. They concluded the ARIMA model as a more accurate method (7).
Pantoh et al. also proposed the MLP model for forecasting cases in South Korea. The MLP model has been proposed as an appropriate model for forecasting the number of confirmed, recorded, and fatal cases using cumulative data in this country (9).
Moreover, Long Short-Term Memory (LSTM) and XGBoost are other machine learning methods that were used by Hu et al. (39) and Paliari et al. (40). Hu et al. predicted Lake Erie wave heights and periods using XGBoost and LSTM methods in 2021. The XGBoost model yielded the best overall performance by MAPE values (39). In another research, Paliari et al. compared LSTM, XGBOOST, and ARIMA on Australian stock market data. In general, the performance of the LSTM model was proven fairly good and slightly better than the XGBoost (40). In our study, based on the literature, one of the most powerful algorithms for forecasting (family of XGBoost models) is used. It works almost similar to the LSTM method (another strong method) in terms of accuracy.
It is worth to be noted that using important predictive variables and high predictability, the models used in this study may act more accurately. Still, the unavailability of effective predictors on confirmed, death, and recovered cases is the limitation of this study.
This work attempted to extend modeling to forecast confirmed deaths and recovered cases for Iran to more models, identify the appropriate model, and reveal behavior patterns of SARS-CoV-2 using clustering analysis. The SARS-CoV-2 behavior patterns were revealed in similar countries and six groups. In Iran, COVID-19 showed similar behavior patterns with the developed countries studied.
The ARIMA, ARIMA XGBoost Error, ETS, Prophet, Naive, s-Naive, and Prophet XGBoost Error models were applied for forecasting purposes. The family of XGBoost models showed practical results and high precision in forecasting behavior patterns of the virus. Considering the rapid spread of the virus worldwide, these models can be used to forecast the behavior patterns of SARS-CoV-2. Preventing the spread of the coronavirus, controlling the disease, and breaking down its chain necessitate community assistance, and in this mission, the role of statisticians cannot be neglected.
TThe authors are thankful to the respected editors and the referees.
None.
Conflicts of Interest
The authors have no actual or potential conflicts of interest related to this manuscript.
Received: 2021/07/18 | Accepted: 2022/01/30 | ePublished: 2022/03/20
| Rights and permissions | |
 |
This work is licensed under a Creative Commons Attribution-NonCommercial 4.0 International License. |
Copyright Policy
Iranian Journal of Medical Microbiology by Farname is licensed under CC BY-NC 4.0![]()
![]()
![]()
