


![]()
![]()
![]()
BibTeX | RIS | EndNote | Medlars | ProCite | Reference Manager | RefWorks
Send citation to:
URL: http://ijmm.ir/article-1-1069-en.html

 , Ashrafalsadat Hatamian-Zarmi 2, Ghassem Amoabediny3 , Bahman Ebrahimi-Hosseinzadeh1 , Hale Alvandi1 , Ali Doryab3 , Amir Salehi4
2- Department of Life Science Engineering, Faculty of New Sciences and Technologies, University of Tehran, Tehran, Iran , hatamian_a@ut.ac.ir
3- Research Center for New Technologies in Life Science Engineering, University of Tehran, Tehran, Iran
4- Department of Microbiology, School of Biology, College of Science, University of Tehran, Tehran, Iran
.
Ganoderma lucidum is widely used in Asia to treat health problems and increase vitality and longevity. These mushrooms offer various health benefits, including immunomodulatory, antitumor, antibacterial, antiviral, anti-diabetic, and anti-oxidant properties [1, 2]. Ganoderic Acid (GA) is a type of triterpenoids produced by G. lucidum and is considered a secondary metabolite [3]. Some GAs can inhibit cholesterol synthesis and tumor growth, which can effectively cure cancer [4, 5]. However, due to the low efficacy of GA production from G. lucidum, these useful metabolite applications have been limited.
Therefore, investigations are growing to enhance the GA biosynthesis’ efficiency by evaluating diverse conditions, in desired parameters such as pH, oxygen pressure and shear stress [6-8]. Furthermore, several studies have been performed to find suitable culture media for optimizing the production of mycelial biomass and secondary metabolite. Although available studies suggests that the more complex media are superior in cell growth and production of secondary metabolites compared to other media, such as semi-synthetic [9], further research is needed to improve the efficacy of production. It has also been reported that the biomass and secondary metabolite yields are increased by improving the oxygen supply [10, 11]. On the other hand, before scale-up studies, the traditional cultivation process has required the screening of large numbers of samples, and consequently, a vast number of development cultivations should be performed. So far, many investigations have been done to enhance G. lucidum production; however, in all of these studies, the lack of an efficient monitoring system is apparent. In fact, we can find useful information through the cultivation and obtain the necessary data for process development by monitoring the procedure. Several small-scale platforms have been developed for high throughput screening and process development.
Nevertheless, one of the most efficient and useful platforms is miniaturized bioreactors. They are widely used as tools for drug screening and discovery, optimization of media, strain, and production [12]. Miniaturized shaken bioreactor systems are also applied to measure the Oxygen Transfer Rate (OTR) during fermentation. OTR is an essential factor in obtaining more data by culturing the strains [13].
In the present work, for the first time, online and offline monitoring using miniaturized bioreactors was used for G. lucidum production concurrently as well as GA biosynthesis. Many different media were used in earlier studies; however, we tried to evaluate their different components in this study.
Moreover we examined the effects of these media on the growth of G. lucidum, level of oxygen consumption, and GA production. In practice, G. lucidum and secondary metabolite production’s growth behavior using a miniaturized shaken bioreactor system suggested the best culture medium for maximal production of GA. These data are so beneficial for find a better idea to increase G. lucidum yields, and it would suggest solutions for challenges.
Strains and Cultural Conditions
G. lucidum (Sp. GIRAN17) was obtained from bioscience faculty, Shahid Beheshti University, Tehran, Iran. It has been screened from Carpinus betulus L. (Corylaceae) from Mazandaran, Iran [14, 15]. The strain of G. lucidum was cultured on potato dextrose agar (PDA) plates according to prior study [16]. The optimum conditions for this fungus growth were temperature (25°C), aeration (130 rpm), and initial pH (6.5). Due to the effect of media pH on the stability of GA production and cell growth, the pH of media was kept constant during cultivation.
Studies show that high concentrations of primary glucose lead to increased biomass production and GA biosynthesis [17]. Adding vitamin B1 to the culture medium also increases productivity [18]. The aerated shaken flasks (online) and ventilation flasks (offline) included 20 mL broth culture [15, 17]. Four broth culture media were chosen to evaluate the growth kinetics of G. lucidum (Table 1), and inoculum size was 10% v/v for each broth flasks. In addition to online monitoring of the OTR during cultivation, we performed offline monitoring to measure biomass formation, residual sugar, and GA production using parallel flasks in given intervals during the fermentation time course. All the conditions of the online and offline flasks for each broth culture were kept constant.
The Miniaturized Shaken Bioreactor System
For online measurement of the respiration activity of G. lucidum in small scales bioreactors, aerated shaken flasks (AF) were used (Figure 1A). In this modified 250 ml Erlenmeyer flasks, all of the conditions except the culture medium were the same [19]. Each AF contained a different culture medium: AF1 contained PDB (basal medium), AF2 contained PDB and vitamin B1, AF3 contained YPG, and AF4 contained complex media (Table 1). Briefly, on-line monitoring based on OTR was performed and the partial pressures were monitored using an oxygen sensor. The OTR was calculated by the following equation:
Equation 1
Where ΔpO2 is a difference of oxygen partial pressure (Pa), VG is the gas volume (L), VL is the liquid volume (L), R is gas constant (L.Pa/K.mol), T is the temperature (K), and Δt is the time of the measuring phase (h).
Table 1. Operating conditions of aerated shaken flasks
| Flow rate (L/h) |
Flask volume (mL) |
Gas volume (mL) |
Working volume (mL) |
Culture medium | Flask Number (AF and VF) |
||
| 1.2 | 260 | 240 | 20 | Potato dextrose broth (PDB) | 1 | ||
| 1.2 | 260 | 240 | 20 | PDB+ 0.05 g/L vitamin B1 | 2 | ||
| 1.2 | 260 | 240 | 20 | Yeast extract 2.5 g/L, peptone 5 g/L and glucose 35 g/L (YPG). | 3 | ||
| 1.2 | 260 | 240 | 20 | Complex media (glucose 35 g/L, peptone 5 g/L, yeast extract 2.5 g/L, KH2PO4·H2O 1 g/L, MgSO4·7H2O 0.5 g/L, and vitamin B1 0.05 g/L) | 4 | ||
| AF1, AF2, AF3 and AF4: online monitoring | VF1, VF2, VF3 and VF4: offline monitoring | ||||||
OTRplug = kplug · (1/VL · pabs) · (pO2, out − pO2)
Equation 2
Equation 3
for VF type 1; a : 22.4×10⁶ , b: 6.95×10³, c: 19.97 [21]
Therefore, to find more information through G. lucidum growth, four factors, including biomass formation, GA, residual sugar, and gene expression were evaluated on days 0, 2, 4, 6, 8, 9, 11, 13, and 14 by 35 pcs of VFs. Each run was performed at 130 rpm and the temperature was set at 25°C for fourteen days.

As mentioned earlier, an offline monitoring flask or ventilation flask was used to measure four parameters namely dry biomass, GA, residual sugar, and gene expression. The selected ventilation flasks have the same aeration value (1.2 vvm) as the aerated flask used in online monitoring. Mycelium was isolated from liquid media by centrifugation and was dried by a freeze dryer (Alpha 1–2 LD Plus, Christ, Germany) to measure dry cell weight. Residual sugar concentration was also measured by the phenol–sulfuric acid method [18]. The average specific growth rate (µ) and the specific GA production rate (qGA) were obtained from the following equations:
µ = Equation 4
qGA = Equation 5
When X is cell concentration. Oxygen consumption during cultivation was also determined by the integration of the OTR profile as follows:
Oxygen uptake = Equation6
Assay of Ganoderic Acid
According to literature [18], GA was extracted after obtaining dried mycelium. Briefly, to extract GA, 100 mg of dried biomass is added to ethanol 50% (v/v) twice for one week, and then biomass was isolated by centrifugation (25 min, 12,000g). Additionally, the supernatants were dried at 50°C under vacuum conditions, and the residue was dissolved in a few milliliters of water besides extracting the aqueous solution with 2 mL of chloroform. The GA extraction from chloroform is performed with 5% NaHCO3 (w/v) and the pH of the solution is adjusted by the addition of hydrochloric acid (below 3). GA residues were then extracted by chloroform and in the next step, the remaining chloroform was evaporated at 40°C. The GA content was dissolved in absolute ethanol and measured at 245 nm in a spectrophotometer (T80, PG Instruments Limited, London) as standard [22].RNA Isolation and Quantitative real-time PCR
A 0.1g Aliquot of mycelium was separated from the culture medium and frozen by liquid nitrogen. Total RNA was extracted by RNX plus (Sinacolon, Iran). cDNA synthesis was performed by a synthesizing kit (Amplicon, Denmark). The random primer was used for cDNA synthesis. Then, transcript levels of hmgr and sqs were determined by quantitative real-time PCR using SYBR Green (Applied biosystem, USA). The 2 - ΔΔ CT method was employed to analyze relative gene expression [23]. 18srRNA primer was used as an internal control and to normalize the data for the gene expression. The sequences of the hmgr and sqs primers have been described in the literature. The primers sequences were as follows: hmgr forward: 5'-GTCATCCTCCTATGCCAAAC-3', hmgr reverse: 5'-GGGCGTAGTCGTAGTCCTTC-3', sqs forward: 5'-ACAGTTGTCAGCGAAGAGC-3', sqs reverse: 5'-CGTAGTGGCAGTAGAGGTTG-3', 18S rRNA forward: 5'-TATCGAGTTCTGACTGGGTTGT-3', 18S rRNA reverse: 5'-ATCCGTTGCTGAAAGTTGTAT-3' [24, 10].The expression level 1 was selected for samples for the PDB culture and fold changes were done in comparison with it. An initial denaturation stage were at 95°C for 5 min, the amplification conditions were in a three-step procedure: 30s at 94°C (denaturation), 30 s at 56°C (annealing), and 30 s at 72°C (extension) followed by 40 cycles.
Statistical analysis
Experimental results were analyzed statistically using Student’s t-test (S). All runs were carried out in triplicate. A probability (p) value of less than 0.05 (P<0.05) was taken as the level of significance
Online monitoring
Miniaturized shaken bioreactor system provides a rich source of data by studying the OTR profile in each fermentation period, such as physiological responses of aerobic microorganisms to specific culture conditions, inhibition of the product, diauxic growth, and other biological phenomena. The OTR evolutions of AF1, AF2, AF3, and AF4 during the cultivation of G. lucidum are shown in Figure 2. At first, in the first 100 hr of cultivation, no fundamental changes were detected. The OTR for AF1 and AF2 achieved their maximal values of 2 and 3.2 mmol/Lh at 150 hr and 160 hr, respectively. Although by culturing under AF1 and AF2 the growth behavior of G. lucidum was the same, the maximal OTR of AF2 was more than that of AF1, which can be attributed to vitamin B1. By analyzing the AF3 OTR profile, we found that two maximal values of 3.5 and 4.9 mmol/Lh occurred at 140 hr and 210 hr, respectively. Furthermore, with fermentation in complex media (AF4), maximal values of 3.8 and 10 mmol/Lh occurred at 155 hr and 220 hr, respectively.The OTR evaluation results also indicated that with culturing in AF1 and AF2, the OTR curve sloped downward after achieving their maximum value.

Cultivation of G. lucidum using offline monitoring was also carried out to examine the biomass formation, GA biosynthesis, residual sugar, and gene expression during certain times. The combination of an offline and online monitoring can be beneficial for kinetic analysis of biomass formation and GA production.
Figure 3 shows the biomass production of G. lucidum during cultivation. After 48 hr, the biomass formation increased under VF1-VF4, and the maximum cell concentration was achieved after 192 hr. Then, the biomass almost remained constant until the end of the period despite the corresponding depletion of sugar concentration. During cultivation, a lag phase of two-day was considered for all the flasks. It is also observed that the culturing of G. lucidum under VF4 yielded the maximum biomass (18.5 g DW/L) compared to other flasks. The maximum biomass accumulation under VF3, VF2, and VF1 were 15.25, 12.25, and 11.25 g DW/L, respectively. Evaluation of the total cell concentration during fermentation demonstrated that biomass production in a more complex broth culture (VF4) was 1.6-times higher than that in the basal medium (VF1). The sugar consumption profiles in all flasks have the same permanent declining trend. Further analysis shows that on the thirteenth day, residual sugar was almost depleted for all cases. Moreover, more complex media (flasks 3-4) that contain richer carbon sources experienced higher cell growth than less complex ones (flasks 1-2).
GA production analysis demonstrated that GA was produced after 144 h in all flasks and then by the rest of culturing this substance was accumulated continuously (Figure 2). Maximum GA production of VF4 was obtained equal to 270 mg/L 4 times more than the VF1.
Further analysis demonstrated that by culturing G. lucidum under different media (flasks 1-4), gene expression of hmgr and sqs had been experienced a sharp increase after 96 hr (Figure 4), which coincides with the starting of GA biosynthesis (Figure 2). For more complex media (flasks 3-4), another increase is observed after 192 hr. Also, gene expression of hmgr and sqs at the end of cultivation were 1.45- and 2-times higher than their initial value at beginning of culturing, respectively. The final gene expression analysis under different culture media demonstrated this parameter was increased 1.25 and 1.81 times in VF3, and 1.2 and 1.6 times in VF2 for hmgr and sqs, respectively. In all cases, the gene expression of sqs was higher than that of hmgr.

Figure 3. Monitoring of residual sugar and biomass formation expressed in g/L and g DW/L, respectively using ventilation flasks (VF) during culturing of G. lucidum with different media culture (n=3).
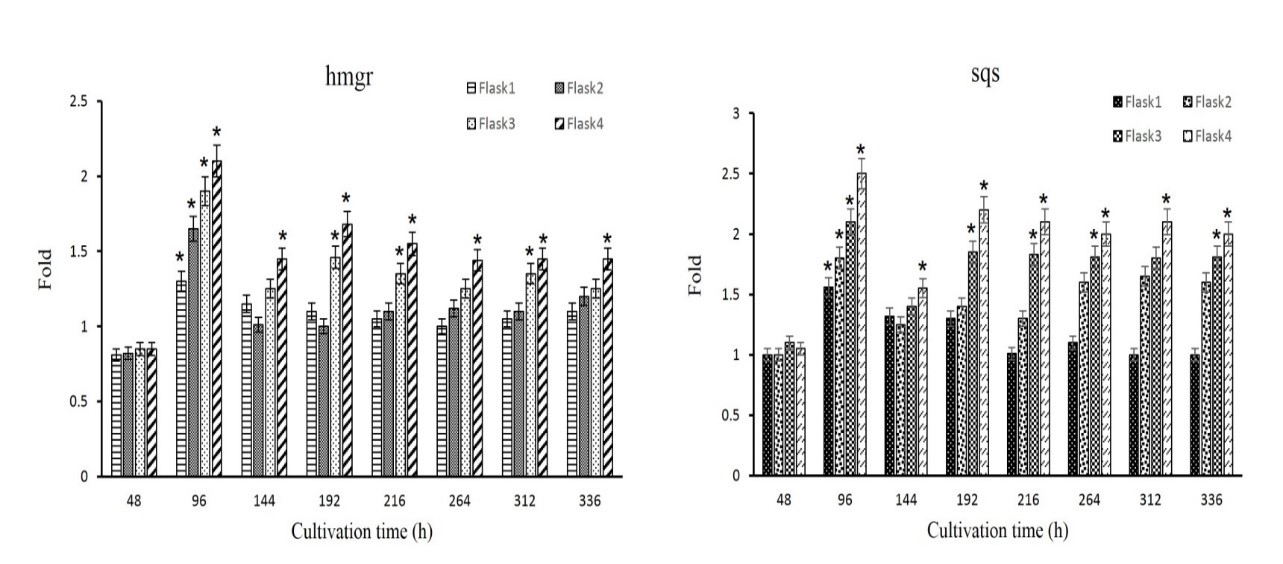
Figure 4. Comparison analysis of gene expression of hmgr and sqs in flasks 1-4 (*indicates P < 0.05 compared to PDB culture).
Kinetic Analysis of Biomass Formation and GA Production
The kinetic profiles of the mycelial growth and the GA accumulation of G. lucidum in the miniaturized shaken bioreactor systems in addition to residual sugar and gene expression were monitored and shown in four different media simultaneously.
According to the OTR profile of AFs through fermentation, the oxygen consumption for AF4, AF3, AF2, and AF1 were calculated to equal with 1.47, 0.76, 0.40, and 0.17 mol/L, respectively. It is concluded that the oxygen consumption of AF4 including more complex media is 8.6-fold higher than that of AF1 as a basal broth culture. Residual sugar analysis suggested that reducing in OTR values can be attributed to the depletion of carbon sources from media cultivation.
Measuring the average specific growth rate (μ) indicated that the μ for VF4, VF3, VF2, and VF1, was 0.237, 0.211, 0.190, and 0.175 d-1, respectively. Culturing under VF4 was approximately 1.4-times higher in growth compared to VF1.
With culturing by a more complex carbon medium (flask 4), the specific cell growth rate (μ) achieved two maximal values of 0.276 d-1 and 0.247 d-1 at 6 d and 8 d respectively. Moreover, culturing by using more than one carbon source (flask 3) the specific cell growth rate (μ) of VF4 obtained two maximal values equal to 0.252 d-1 and 0.190 d-1 at the same time. However, with fermentation under VF2 and VF1 (basal medium), the specific cell growth rate (μ) achieved maximal value of 0.190 d-1 and 0.175 d-1 at 8 d. At maximum GA production, the growth curve can be divided into two phases: growth and production. Each phase has a specific growth rate (μ).
Also, by cultivation under VF4, the maximal specific GA production rate (qGA) was obtained 1.84×10⁻³ (g GA. g/DW.h), which was almost 2.8-times higher than VF1 0.65×10⁻³ (g GA. g/DW.h). Consequently, compared to VF2 and VF1, the growth rate of VF4 and VF3 sharply increased, and the main GA was produced between 144-216 h.
Transcript levels of hmgr and sqs indicated that the maximum gene expression is accessible when GA starts to produce and after that, they have a steady trend, until the end of fermentation. Furthermore, more gene expression levels of flasks 3-4 can be attributed to enhancing in GA production.
Table 2 presents the growth behavior of G. lucidum in flask 4 during fermentation. The critical time courses are highlighted. It seems that the interval between hours 134 and 312 when the changes of biomass and GA production coincided with the OTR evolution, was the crucial time for G. ludicum. Therefore, this interval is suggested as the critical time for G. lucidum growth.
Table 2. Growth behavior of G. lucidum under AF4 and VF4
| Time range (h) Monitoring |
0-96 | 96-134 | 134-168 | 168-216 | 216-312 | 312-336 | ||||
| AF (online) |
OTR (mmol/Lh) |
0 | increase up to 3.5 | constant 3.5 | increase up to 10 OTR max: 10 |
decrease to 2 | constant 2 |
|||
| → | ↑ | → | ↑ | ↓ | → | |||||
| VF (offline) |
biomass (g DW/L) |
increase up to 11.3 µ1 :0.276 (d-1) |
increase up to µ2 :0.247 (d-1) |
almost constant |
||||||
| ↑ | ↑ | → | ||||||||
| GA (mg/L) |
almost no production | increase up to 270 | constant | |||||||
| --- | ↑ | → | ||||||||
| Residual sugar (g/L) |
almost steady depletion | main sugar consumed | almost exhausted | |||||||
| → | ↓ | ↓ | ||||||||
The Yield of Oxygen Consumption per GA Production, Biomass Formation, and Productivity
As shown in Figures 2 and 3, the ratio of biomass per GA production rose in 216 initial hours; however, it reached its lowest value afterward. Further, between hours 216 and 312 of fermentation, no cell growth is observed despite GA production. It can be argued that in this interval the GA production is partially growth-associated. To obtain more information about this interval, we measured the yield of oxygen consumption per GA biosynthesis (YO2/GA), the yield of oxygen consumption per biomass production (YO2/X), and the productivity (YX/GA) (Eq. 7, 8, and 9).
( ) = Equation 7
( ) = Equation 8
( ) = Equation 9 For this purpose, a more complex medium (i.e. flask number 4) was chosen due to its high cell growth and secondary metabolite production. Based on oxygen consumption, GA production, and biomass formation, desired parameters such as YO2/GA, Y O2/X, and productivity during fermentation were measured at given times (Figure 5).
The maximum YO2/X was obtained in 264 h while no increase in cell growth is observed at this time (Figure 3). So, it can be concluded that a large portion of oxygen has been consumed to produce GA. Also, the highest amount of oxygen per GA biosynthesis is seen at 144h in which GA starts to produce (Figure 2). In fact, at the beginning of GA production, the majority of oxygen was consumed. At this time, culturing G. lucidum has the highest productivity. As a consequence, these results could approve OTR trends (Figure 2).
Since most GA was synthesized between hours 192 and 312, this interval was further analyzed to obtain more useful information. Between these ranges, oxygen consumption was not specified, and, this value should be subtracted from the amount of oxygen consumption by biomass formation to determine a better estimation of oxygen uptake by GA production. Therefore, two intervals were chosen; interval one (0-144 h) in which there was no GA biosynthesis, and interval two (192-312 h) with the main GA production. In the first interval, oxygen consumption was calculated to be 0.225 mol/L. This value for the next interval, when GA began to produce, was 0.986 mol/L. Based on biomass analysis (Figure 3), the main mycelia was produced in the first interval (0-144 hr). On the other hand, the cell growth rate decreased in the second interval, suggesting that by secondary metabolites (GA) consumed most of the oxygen. Therefore, to measure GA’s oxygen consumption during the second interval, we should obtain the amount of oxygen consumed by mycelia in interval two. Finally, the actual oxygen consumption by GA production and YO2/GA was calculated to be equal with 0.761 mol/L and 3.81 mol/g, respectively. It can be concluded that after reaching maximal biomass accumulation, most of the oxygen has been consumed by secondary metabolite, and consequently GA production was partially growth-associated.
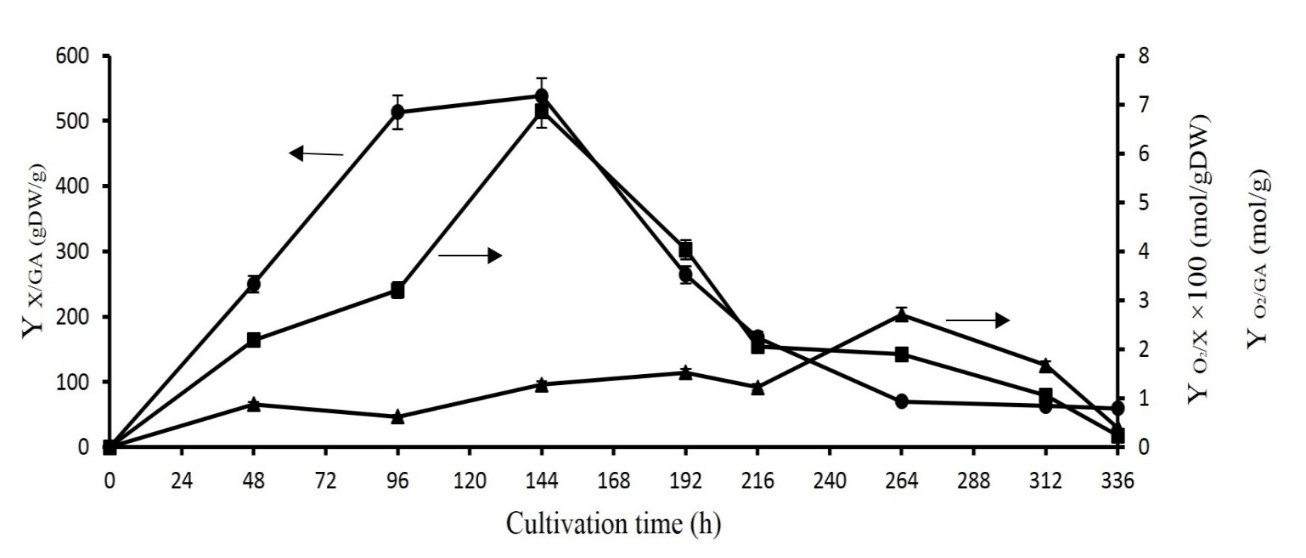
Figure 5. Yield of oxygen consumption per GA production (YO2/GA) (■), Yield of oxygen consumption per biomass production (YO2/X) (▲), and productivity (YX/GA) (●) of culturing G. lucidum under more complex media (flask 4). The error bars show the standard deviation (n=3).
On-line and off-line G. lucidum cultivation monitoring provided insight into its growth kinetics during fermentation. Production of valuable metabolite, i.e, GA in various cultures media indicated that maximum oxygen consumption, cell concentration, and GA production occurred when this mushroom was cultured under a more complex medium (flask 4). High maximum biomass and GA production were obtained at an initial glucose concentration of 35 g/L with the presence of vitamin and KH2PO4. Under these conditions, the growth curve was two-phase and oxygen limitation did not occur. A high cell respiratory activity, superior cell growth, and secondary metabolite production were observed under the cultivation of a more complex medium and as a result, this media can be suggested as an optimized media for G. lucidum. The start time of secondary metabolite production can also be estimated by using the OTR evaluation. It was indicated that GA production was partially growth-associated. Additionally, overexpression of hmgr and sqs genes, which are involved in the GA’s biosynthesis pathway, confirmed the results of monitoring. Earlier investigations have tried to examine different factors and conditions to enhance the production of G. lucidum. Despite prior research on G. lucidum, this study has introduced an online monitoring strategy that is more efficient, unsophisticated, and cost-effective than conventional methods. Finally, since finding cell growth behavior during cultivation is always considered a challenging issue, this method can be beneficial for studying the growth kinetics of other mushrooms.
The authors would like to thank the Faculty of New Science and Technologies, University of Tehran. The authors also are so grateful to Mr. Ebrahim Amoabediny for his kindly efforts.
The authors declared no conflicts of interest
Received: 2020/02/29 | Accepted: 2020/12/6 | ePublished: 2021/01/10
| Rights and permissions | |
 |
This work is licensed under a Creative Commons Attribution-NonCommercial 4.0 International License. |
Copyright Policy
Iranian Journal of Medical Microbiology by Farname is licensed under CC BY-NC 4.0![]()
![]()
![]()
